Abstract
The aim of this study was to test the hypothesis that computed tomography texture analysis (CTTA) is accurate for response assessment of Hodgkin lymphoma (HL).
A total of 100 patients with HL were identified. CTTA in baseline and interim staging was performed generating volume of interests in lymphoma tissue from which CTTA features including 1st, 2nd, and higher order textural features were extracted. Baseline and interim 2-deoxy-fluor-glucose positron emission tomography results were used to determine therapy response and compared to CTTA in terms of patient outcome.
At interim, 1st-order features yielded a significant drop (e.g., entropy of heterogeneity, P = .01) or a significant rise (deviation, P < .001), whereas 2nd and higher order features decreased (e.g., entropy of co-occurrence matrix, P < .001). Patients achieving complete remission at end of treatment had a significantly lower entropy of heterogeneity at baseline and interim compared to patients achieving partial remission (P < .05).
CT textural features change in parallel to metabolic therapy response, and are therefore a feasible diagnostic tool for a more accurate response assessment of HL.
Keywords: computed tomography texture analysis, Hodgkin lymphoma, response assessment
1. Introduction
Early evaluation of treatment response in lymphoma patients is important for treatment and prognosis.[1–3] Particularly in Hodgkin lymphoma (HL), interim response assessment is important for the duration and intensity of chemotherapy, and the need for additional radiation therapy.[3] For this reason, 18F-2-deoxy-fluor-glucose (18F-FDG) positron emission tomography (PET) is the primary imaging modality for the evaluation of the short-term metabolic response of lymphoma.[4] Metabolic response assessment is considered reflective of the cell density of lymphoma, which can be detected as early as 1 week after the onset of treatment.[5] According to 18F-FDG-PET response criteria,[6] residual glucose uptake after 1 to 2 treatment cycles is a sign suggesting the need for intensification of treatment.[3] Benefits of treatment adaption based on 18F-FDG-PET findings have been reported both for low-stage and advanced stage HL.[1] Similarly, functional magnetic resonance imaging (MRI) using water diffusivity measurements in lymphoma tissue (diffusion-weighted imaging, DWI) has been used successfully in the same clinical setting and found to correlate well with 18F-FDG-PET findings.[5] DWI can capture treatment response in lymphoma within 1 week of treatment onset.[7]
Contrast-enhanced computed tomography (CECT), however, is most commonly used worldwide for staging and response monitoring of HL due to its wide availability and comparably lower costs. As most lymphomas respond excellent to treatment, morphologic changes are often sufficient for assessing treatment response and stratifying prognosis, in particular in patients with a low burden of lymphoma tissue were rapid mass resolution is expected. However, in patients with larger lymphoma masses, early complete volume-based resolution is not expected. For this reason, the addition of other CT markers, such as tumor attenuation (size and attenuation CT criteria, SACT) and perfusion CT have been investigated to assess changes in tumor vascularity during chemotherapy.[8,9]
More recently, computer tomography-based quantitative textural image analysis (CTTA) has been used for tissue characterization.[10] The CT textural features can be used for more accurate tissue characterization including ultrastructural analysis of the vascular network on CECT images and treatment response monitoring[10]; however, these features have not been evaluated in HL.
Therefore, the purpose of our study was to test the hypothesis that CECT texture analysis is accurate for the response assessment of HL undergoing chemotherapy.
2. Material and methods
2.1. Patients
Our single center study protocol was approved for retrospective evaluation of patient data by our institutional ethics committee with a waiver of the informed consent requirement (project number 467/2018BO).
A search of our hospital information system derived 100 consecutive patients (46 women and 54 men; mean age, 39.2 years, range, 19–80 years) who underwent different standardized chemotherapy regimens for HL, CECT, and 18F-FDG-PET/CT between January 2015 and January 2018. The stage of Hodgkin disease was assessed according to the Ann Arbor classification.[11]
2.2. Computed tomography
All CT studies were performed with patients in the supine position using 128-slice Multidetector computed tomography (MDCT) scanners (SOMATOM Definition AS+ or SOMATOM Definition Flash, or Biograph 128 PET/CT Siemens Healthcare, Forchheim, Germany). The CT protocol included the intravenous administration of 120 mL of nonionic iodinated contrast material (370 mg/mL iopromide; Ultravist, Bayer Vital, Leverkusen, Germany), which was injected with a rate of 2.5 mL/s in an antecubital vein followed by a saline flush of 50 mL NaCl at a rate of 2.5 mL/s (Stellant, Medtron, Saarbruecken, Germany). CECT thorax images were obtained 30 s after intravenous contrast application and abdominal/pelvic images after 70 seconds. Scan parameters included 0.6 mm collimation, 0.5 seconds rotation time, and 0.6 mm increment. Acquisition parameters were identical for the used MDCT scanners. Images were obtained at 120 kVp tube voltage. The tube current was 180 mAs for the neck, 100 mAs for the chest, and 200 to 250 mAs for the abdomen. The matrix size was 512 × 512, the window center 50/300 and the window width 300/1500. We used a soft-tissue reconstruction kernel (B30f).
2.3. 18F-FDG-PET/CT
All patients fasted for at least 4 hours before the examination, and the blood sugar level was confirmed to be lower than 140 mg/L before the injection of 18F-2-deoxy-fluor-glucose (18F-FDG). Patients received 3 MBq/kg body weight 18F-FDG intravenously and were examined 60 minutes after tracer injection. All PET/CTs included a CECT examination. An integrated state-of-the art clinical PET/CT scanner (Biograph mCT, Siemens Healthineers, Knoxville, TN) consisting of a CT scanner with a 16-row multislice detector system, and a PET scanner equipped with a full-ring lutetium oxyorthosilicate system and crystal size of 4 × 4 mm2 was used. Emission data were acquired for 6 to 8 bed positions, typically from the apex of the skull to the upper thigh. The acquisition time was usually 3 min/bed position, resulting in a total PET scan time of approximately 20 to 25 minutes using 7 or 8 bed positions. The CT data were used for attenuation correction of PET emission images. PET images were reconstructed with an iterative algorithm (ordered-subset expectation maximization: 2 iterations, 8 subsets on a 128 × 128 matrix, with Gaussian postfiltering of 5 mm).
2.4. CT texture analysis
The CTTA was performed in both CECT and PET/CT using standardized examination protocols and a dedicated radiomics software (Siemens Healthcare, Erlangen, Germany) that is based on the pyradiomics package, a python package for the extraction of radiomics features from medical imaging.[12] A slice thickness of 1 mm was used. Region of interests (ROIs) were drawn manually in lymph nodes carefully excluding visibly necrotic areas and neighboring tissues like blood vessels. This procedure of ROI setting was performed by 2 radiologists in consensus who had an experience of 2 years and 5 years in CTTA. Standardized measurements were performed to provide comparability for all data sets. All set ROIs were used to generate specific volume of interests (VOIs). The 1st step consisted of image filtration for selectively extracting features of different sizes and intensity variation. In the 2nd step, quantification of tissue texture followed. The computation of each texture type for an input VOI involved assigning a new value (“texture value”) to all voxel of that VOI and thus creating a “texture image.” Thereby, a series of derived images displaying features at a fine spatial scale from texture within a VOI were drawn inside the largest involved lymph node (Fig. 1). Computation was performed on the current voxel and its neighborhood, and the results of that were stored as the current voxel's texture value. This was repeated for every voxel in the VOI. The texture type (e.g., “heterogeneity,” “entropy [co-occurrence matrix]”) defined the specific kind of computation that was performed. The following parameters were computed: 1st statistical order (heterogeneity, intensity, average, deviation, skewness), 2nd statistical order (entropy of co-occurrence matrix [COM], difference variance of COM), and higher statistical order (contrast neighborhood gray-tone difference matrix, NGTDM). For all these parameters, the mean, entropy, and uniformity were calculated. Uniformity is a measure of the homogeneity of the image array, where a greater uniformity implies a greater homogeneity or a smaller range of discrete intensity values.[12] The definition of all texture parameters is provided as supplemental data (Table 1).
Figure 1.
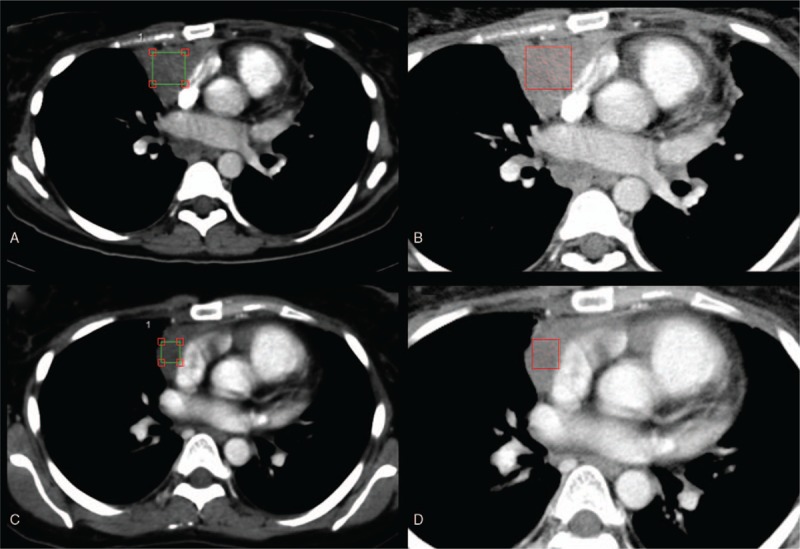
Contrast-enhanced computed tomography texture analysis (CTTA) of a Hodgkin lymphoma patient with a lymphoma mass in the anterior mediastinum before (upper row) and after (lower row) a standardized chemotherapy protocol. For quantification of tissue texture, cubiform volume of interests were drawn inside the lymphoma mass excluding adjacent vessels (A and C). Color-coded CTTA maps display the mean intensity of the lymphoma mass before (B) and after (D) chemotherapy using a fine filter.
Table 1.
Contrast-enhanced computed tomography texture analysis parameters with definitions subdivided into textural features of 1st, 2nd, and higher statistical order.

The 18F-FDG-PET/CT image evaluation was based on the Deauville score and the corresponding response criteria for HL.[6] In our cohort, 33/100 (33%) patients underwent 18F-FDG-PET/CT at baseline, whereas 64/100 (64%) patients had interim 18F-FDG-PET/CT examinations, and 53/100 (53%) patients had 18F-FDG-PET/CT examinations performed at the end of the treatment regimen. All included PET/CT examinations were acquired in full-dose technique and with standardized CT examinational protocols using contrast agent, which were used for CT-texture analysis. Separate statistics were performed for the subgroup of patients receiving 18F-FDG-PET/CT both at baseline and interim staging. 72/100 (72%) patients underwent in house follow-up examinations within 1 year after, at the end of the treatment, 14/72 (19.4%) underwent at least one 18F-FDG-PET/CT, whereas 58/72 (80.6%) patients underwent CT examinations at follow-up.
2.5. Statistics
Statistical analysis was performed using SPSS Version 22 (IBM Corporation, Armonk, North Castle, NY). The results are expressed as average with standard deviation. The Kolmogorov–Smirnov test was used for testing if the variables follow a normal distribution. As assessed by the Kolmogorov–Smirnov test, the textural parameter values were not normally distributed (P < .05). Therefore, the nonparametric Mann–Whitney U test was used to compare textural parameters at baseline and interim staging. To address the multiple comparisons, a Bonferroni correction was applied. The adjusted P-values were considered significant at a level of .05. The predictive performance was assessed by estimating predictive values, sensitivity and specificity, and the area under the curve (AUC) with receiver-operating characteristic (ROC) curves. The ROC curve was generated by computing sensitivity and specificity at each observed cut-off. The selection of the optimal cut-off values was made manually, for the point on the ROC curve with the minimum distance to the upper left corner (where sensitivity = 1 and specificity = 1). Confidence intervals (CIs) were calculated using the bootstrap method.
3. Results
3.1. Study population
At baseline (staging), 49/100 (49%) patients had a limited disease stage (stage IA, 6/100 [6%]; stage IIA, 34/100 [34%]; stage IIB, 9/100 [9%]), whereas 51/100 (51%) for patients with disease had an advanced disease stage (stage IIIA, 15/100 [15%]; stage IIIB, 11/100 [11%]; stage IVA, 11/100 [11%]; stage IVB, 14/100 [14%]). At baseline, all 33 patients who also underwent PET/CT had HL scored Deauville 5 (Fig. 2).
Figure 2.
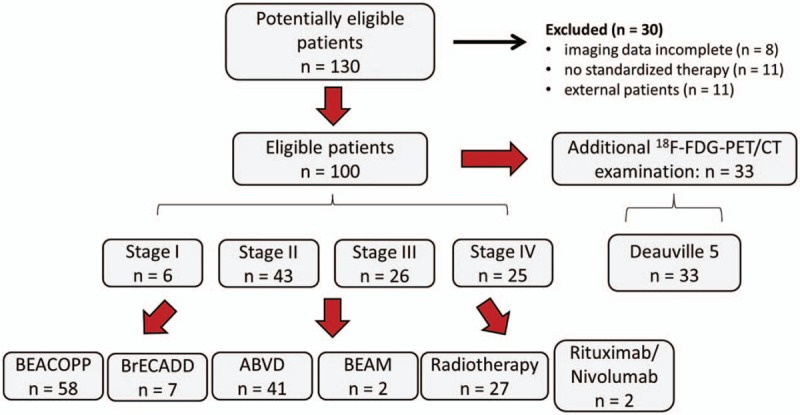
Flow chart of study cohort. 18F-FDG = 18F-2-deoxy-fluor-glucose, PET/CT = positron emission tomography/computed tomography.
At interim staging, 51/64 (79.7%) patients who underwent PET/CT had lymphoma masses scored Deauville 4 (partial remission, PR), whereas 13/64 (20.3%) patients already had a Deauville score ≤3 (complete remission, CR).
At end of treatment, 39/53 (73.6%) patients had a Deauville score ≤3; however, 14/53 (26.4%) patients still had a Deauville score of 4.
Standardized treatment regimens consisted of: BEACOPP protocol (Bleomycin, Etoposide, Adriamycin, Cyclophosphamide, Vincristine, Procarbazine, Prednisolone) (58/100, 58%), BrECADD protocol (Brentuximab Vedotin, Etoposide, Cyclophosphamide, Doxorubicin, Dexamethasone, Dacarbazine) (7/100, 7%), ABVD protocol (Adriamycin, Bleomycin, Vinblastine, Dacarbazine) (41/100, 41%), BEAM protocol (BiCNU, Etoposide, Ara-C, Melphalan) (2/100, 2%). Twenty-seven of 100 (27%) patients were additionally treated with involved field radiotherapy, 1/100 (1%) patient with rituximab, and 1/100 (1%) patient with Nivolumab. Patients underwent interim staging after 2 to 4 cycles of chemotherapy and end of treatment after 4 to 8 cycles of chemotherapy.
In the follow-up examinations within 1 year after end of treatment, 3/14 (21.4%) patients who underwent in-house PET/CT had again lymphoma masses scored Deauville 5 (early relapse). 2/14 (14.3%) patients had lymphoma masses scored Deauville 4. The patients who underwent in-house CT (58/100, 58%) or had external follow-up examinations (28/100, 28%) did not have a clinical or radiological relapse. Of the 3 patients who had an early relapse at 1-year follow-up, 1 patient had residual large, hyperattenuated lymphoma masses in CT at end of treatment, being reclassified retrospectively as having achieved only PR at end of treatment. Table 2 gives a detailed overview of the study population.
Table 2.
Study population.

3.2. CTTA features between baseline and interim staging
Detailed results are shown in Table 3. Using a fine filter, the 1st-order CTTA feature entropy of heterogeneity significantly decreased at interim compared to baseline staging (P = .01), whereas the uniformity significantly increased (P = .01). A significant increase was also observed for mean (P = .01) and entropy of deviation (P < .001) after therapy onset. Both the mean intensity and mean average were significantly lower at interim staging (P < .001), whereas the entropy of skewness was significantly higher at baseline staging compared to interim (P < .001). Both the uniformity of average (P = .01) and uniformity of deviation (P < .001) proved higher at baseline staging, whereas the uniformity of skewness proved lower (P = 0.04). The 2nd-order textural features mean/entropy of entropy COM and mean/entropy of difference variance COM significantly decreased after therapy onset (P < .001), whereas the uniformity of these 2 parameters significantly increased (P < .001). Correspondingly, the higher order textural feature mean/entropy of contrast (NGTDM) showed a decrease after therapy onset (P < .001), whereas its uniformity increased (P < .001).
Table 3.
Patients with Hodgkin lymphoma (n = 100) at baseline staging and interim staging showing significant differences for 1st, 2nd, and higher statistical order computed tomography textural features.

3.3. CTTA features in patients achieving CR or PR at interim staging
The following CTTA features were significantly different in patients achieving CR at interim staging compared to patients achieving PR at interim staging: mean deviation was significantly higher in patients with CR (P < .05), whereas uniformity of entropy (COM) was significantly lower in patients with CR (P < .05) (Table 4). To assess their predictive value, we computed a ROC curve for uniformity of entropy (COM) and calculated 0.25 as a significant cut-off value to differentiate between patients with HL in CR and patients with HL in PR at interim staging (sensitivity 0.76; specificity 0.69; AUC 0.71; 95% CI 0.51–0.91) (Fig. 3).
Table 4.
Interim staging is showing significant different computed tomography (CT) textural features between patients with Hodgkin lymphoma who already achieved complete remission in positron emission tomography/CT (Deauville ≤ 3; 13/64, 20.3%) compared to patients with Hodgkin lymphoma who achieved partial remission (Deauville = 4; 51/64, 79.6%).

Figure 3.
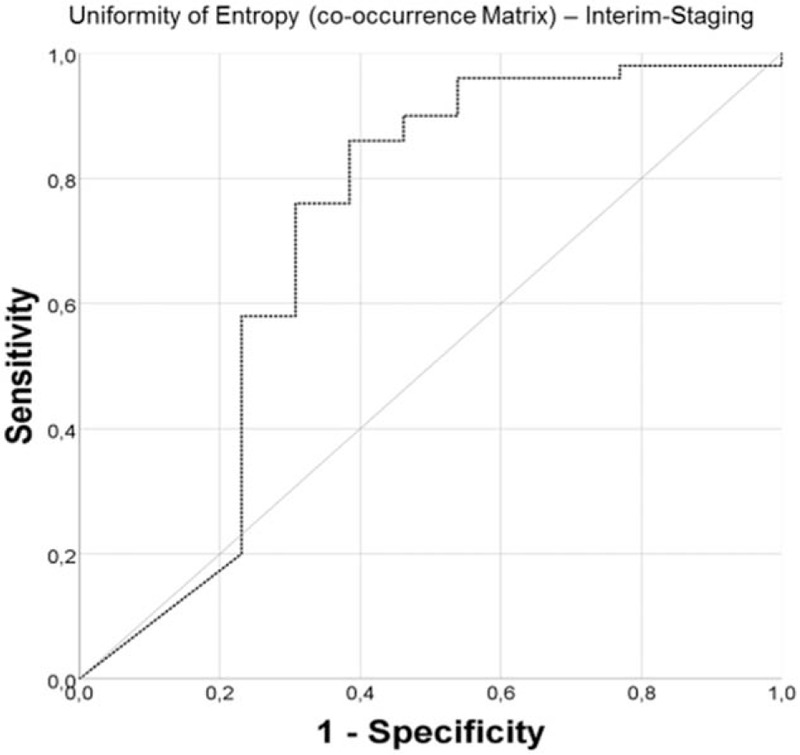
Receiver-operating characteristics analysis for estimation of cut-off values based on the higher statistical order textural feature uniformity of entropy (co-occurrence matrix). Receiver-operating characteristics curve at interim staging for differentiation of patients with Hodgkin lymphoma, who were in complete remission (13/64, 20.3%; Deauville score ≤3) compared to patients who were in partial remission (51/64, 79.6%; Deauville score = 4).
3.4. CTTA features at baseline and interim staging in patients achieving CR or PR at end of treatment
Of the 53 patients who underwent PET/CT at end of treatment, 46 patients also had an in-house baseline and interim staging and could, therefore, afford a comparison of CTTA features and Deauville score after treatment. Thirty-four of 46 (73.9%) patients had a Deauville score ≤3 at end of treatment representing CR, whereas 12/46 (26.1%) patients still had a Deauville score of 4 at end of treatment, which represented PR. Interestingly, the CTTA features of these 2 subgroups showed significant differences of the entropy of heterogeneity (P < .05), which was significantly higher in the subgroup achieving PR after treatment both at baseline staging (P < .01) and interim staging (P < .05) (Fig. 4).
Figure 4.
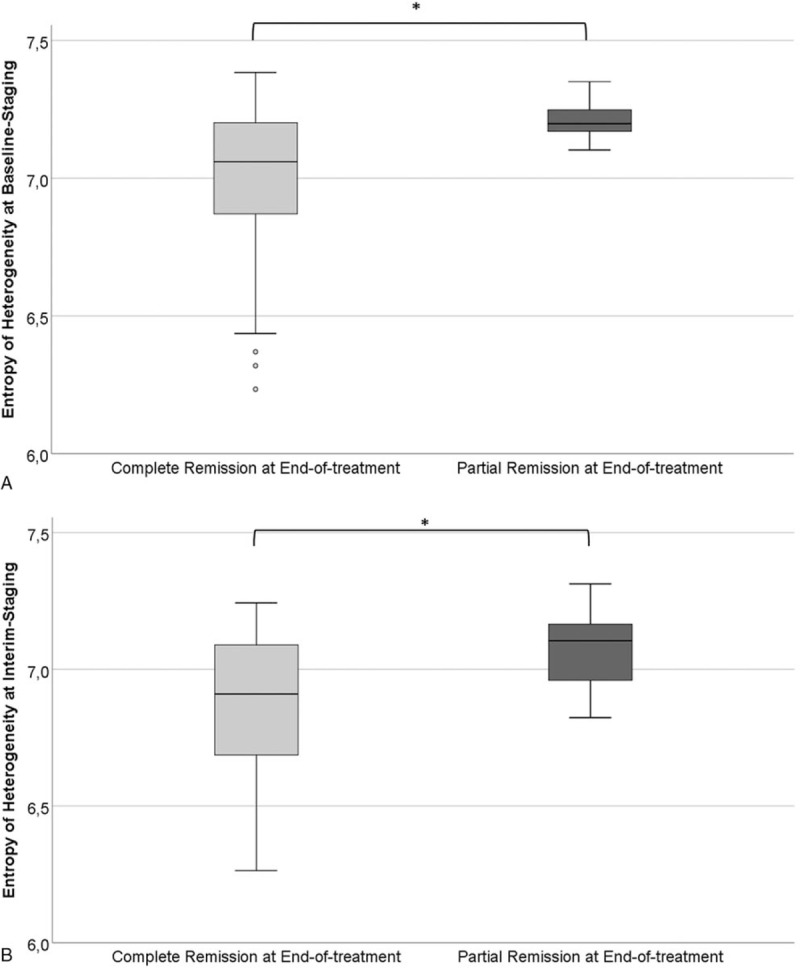
The 1st statistical order textural feature entropy of heterogeneity was significantly lower at baseline staging (A) and interim staging (B) for patients with Hodgkin lymphoma achieving complete remission (39/53, 73.6%, Deauville score ≤3) compared to patients achieving partial remission (14/53, 26.4%, Deauville score = 4) at end of treatment.
The calculated ROC curves for the entropy of heterogeneity are shown in Figure 5. At baseline staging, the cut-off value 7.17 reached statistical significance (sensitivity 0.83; specificity 0.68), whereas at interim staging, we calculated 6.96 as a significant cut-off value (sensitivity 0.75; specificity 0.62) to differentiate between patients achieving CR vs PR at end of treatment.
Figure 5.
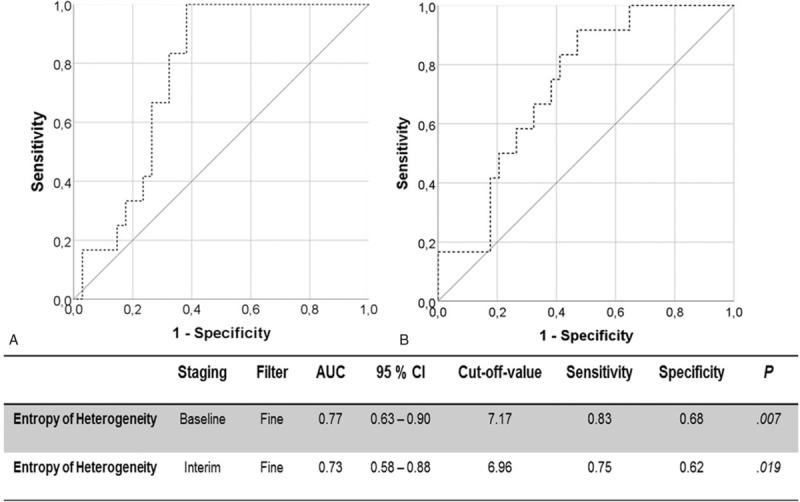
Receiver-operating characteristics analysis for estimation of cut-off values based on the 1st statistical order textural feature entropy of heterogeneity. Receiver-operating characteristics curves for differentiation at baseline staging (A) and interim staging (B) between patients with Hodgkin lymphoma achieving complete remission (39/53, 73.6%, Deauville score ≤3) compared to patients achieving partial remission (14/53, 26.4%, Deauville score = 4) at end-of-treatment.
3.5. CTTA features of histologic HL subtypes
Sixty-seven of 100 (67%) patients had a pathology-proven nodular sclerosis-type classic HL, 8/100 (8%) patients a lymphocyte-predominant HL and 17/100 patients had a mixed-cellularity HL. In 8/100 (8%) patients, the HL subtype could not be assigned histologically with certainty. The CTTA features in these 3 HL subtypes did not differ significantly (P > .10).
4. Discussion
Our results demonstrate the potential benefit for contrast-enhanced CTTA for assessment of interim and final treatment response in patients with HL. The mean tumor intensity significantly decreased at interim in the whole cohort of patients, which can be explained by the substantial reduction in the count of vital cells and accompanying decreasing tumor vascularization. The same was also true for the average, which represents noise independent tumor attenuation. Concomitantly, the entropy of heterogeneity significantly decreased, whereas the uniformity of heterogeneity increased at this time. The uniformity of heterogeneity measures the spatial distribution of pixel gray levels inside a tissue type, whereas its entropy expresses how tumor heterogeneity is changing during chemotherapy.
Previous investigations evaluating textural features for treatment monitoring in other tumors, including esophageal carcinoma and breast cancer using CT and MRI, yielded contrary results of tumor heterogeneity.[13,14] This presumably reflects different response patterns due to varying drug efficacy in HL, where most patients achieve remission at end of treatment with tumor disaggregation and often diffuse tissue necrosis.[2,15] Notably, similar results were reported in renal cell carcinoma treated with tyrosine kinase inhibitors.[16] Overall, the tumor heterogeneity during treatments may vary significantly depending on the characteristics of the primary tumor and the mechanisms of action of the therapeutic agent.[16]
In our cohort, the entropy of heterogeneity of HL at baseline and also interim differed significantly between lymphoma patients achieving CR and PR at end of treatment, based on both 18F-FDG-PET and Lugano classification.[17] Interestingly, the entropy of heterogeneity was lower in the subgroup achieving CR as in the PR subgroup both at baseline and even at interim staging. This is in line with most previous reports in tumors other than lymphoma, where tissue heterogeneity was found to be a negative prognostic factor, which could indicate a more aggressive course.[14] In line with the trend of more uniformity and less entropy in tumor heterogeneity, entropy and uniformity of skewness behaved accordingly in our cohort.
The 2nd-order textural feature entropy of COM is a measure for the gray values of neighboring voxels with lower levels in case same levels occur together. At interim we noticed a drop in the mean value of entropy of COM and entropy of entropy of COM, whereas the uniformity of entropy COM increased. These changes are in line with changes of 1st-order textural features discussed above. Even textural features of higher statistical order like neighborhood gray-tone difference matrix showed the same trend toward a more homogeneous texture of HL at interim, presumably due to the presence of diffuse homogeneous necrosis.
Based on the 18F-FDG-PET at end of treatment, we could classify HL of this subgroup of patients into CR and PR (Deauville score ≤3 vs ≥4). In these 2 classes, textural features differed in particular in terms of mean and entropy of COM, which were lower in the PR subgroup, whereas the uniformity of COM was significantly higher. Cut-off values calculated at baseline as well as at interim follow-up for the entropy of heterogeneity were more accurate for the response classification into CR than 18F-FDG-PET, where FDG-uptake was more heterogeneous at interim and in part also at end of treatment, despite achievement of CR at follow-up in most cases. These false-positive 18F-FDG-PET are suggestive of a known limitation of this technique for which the histopathologic substrate is still unknown. Nonetheless, false positive results seem to be a plausible reason for the failure of interim 18F-FDG-PET to identify patients with a worse outcome or that would not require treatment intensification or radiation.[18] The most frequent difficulties encountered in the interpretation of interim and also posttreatment 18F-FDG-PET scans include differentiating residual FDG due to posttreatment inflammation, coexisting infection, and normal physiologic metabolic activity.[19,20]
Our study has limitations. First, this is a retrospective study in which not all patients had 18F-FDG-PET examinations at interim, end of treatment, or both, and therefore comparison of results with those of CTTA had to be restricted to subgroups. Second, only a limited number of CT textural features were used for analysis to limit the complexity of the results. However, the most frequently applied and robust textural features are those of the 1st and 2nd orders which have been by far most often used as a noninvasive surrogate for spatial heterogeneity in angiogenesis, cellular density, and necrosis. Third, we had no nonresponders in our cohort, which limits statistical analysis but mirrors our clinical experience of most HL patients responding well to treatment. Fourth, long-term surveillance to detect lymphoma relapse was not available as many patients underwent follow-up at outside institutions after achieving CR.
In conclusion, while CT textural features change significantly between baseline and interim follow-up and parallel those of FDG-PET uptake at interim follow-up, cut-off values for entropy of heterogeneity allowed for a more accurate response assessment of HL at end of treatment, because CTTA does not generate false-positive (Deauville 4–5) results that are based on increased glucose metabolism in phagocytes clearing the necrotic lymphoma masses. Patients experiencing early relapse had higher entropy of heterogeneity, lower mean intensity, the lower entropy of deviation and higher entropy of skewness compared to the entire HL cohort. CT textural features could, therefore, be used as adjunct markers to increase the accuracy of treatment evaluation.
Author contributions
LW and CR performed the measurements, HB and BF were involved in histopathology procedures, MH and CR were involved in conception and supervised the work, LW and CR and MH were involved in data analysis and interpretation, CR and MH drafted the article, HB and JF critical revised the article.
Footnotes
Abbreviations: AUC = area under the curve, CECT = contrast-enhanced computed tomography, CR = complete remission, CTTA = computed tomography texture analysis, DWI = diffusion-weighted imaging, 18F-FDG = 18F-2-deoxy-fluor-glucose, HL = Hodgkin lymphoma, MRI = magnetic resonance imaging, NGLDM = neighboring gray-level dependence matrix, NGTDM = neighborhood gray-tone difference matrix, PET = positron emission tomography, PR = partial remission, ROC = receiver-operating characteristic, ROI = region of interest, VOI = volume of interest.
How to cite this article: Reinert CP, Wanek L, Bösmüller H, Federmann B, Fritz J, Sökler M, Horger M. Computed tomography texture analysis for assessment of chemotherapy response of Hodgkin lymphoma. Medicine. 2020;99:7(e19146).
References
- [1].Dann EJ, Bairey O, Bar-Shalom R, et al. Modification of initial therapy in early and advanced Hodgkin lymphoma, based on interim PET/CT is beneficial: a prospective multicentre trial of 355 patients. Br J Haematol 2017;178:709–18. [DOI] [PubMed] [Google Scholar]
- [2].Juweid ME. Utility of positron emission tomography (PET) scanning in managing patients with Hodgkin lymphoma. Hematology Am Soc Hematol Educ Program 2006;259-65:510-1. [DOI] [PubMed] [Google Scholar]
- [3].Zaucha JM, Malkowski B, Chauvie S, et al. The predictive role of interim PET after the first chemotherapy cycle and sequential evaluation of response to ABVD in Hodgkin's lymphoma patients-the Polish Lymphoma Research Group (PLRG) Observational Study. Ann Oncol 2017;28:3051–7. [DOI] [PubMed] [Google Scholar]
- [4].Borchmann S, von Tresckow B, Engert A. Current developments in the treatment of early-stage classical Hodgkin lymphoma. Curr Opin Oncol 2016;28:377–83. [DOI] [PubMed] [Google Scholar]
- [5].Mayerhoefer ME, Raderer M, Jaeger U, et al. Ultra-early response assessment in lymphoma treatment: [(18)F]FDG PET/MR captures changes in glucose metabolism and cell density within the first 72 hours of treatment. Eur J Nucl Med Mol Imag 2018;45:931–40. [DOI] [PMC free article] [PubMed] [Google Scholar]
- [6].Gallamini A, Barrington SF, Biggi A, et al. The predictive role of interim positron emission tomography for Hodgkin lymphoma treatment outcome is confirmed using the interpretation criteria of the Deauville five-point scale. Haematologica 2014;99:1107–13. [DOI] [PMC free article] [PubMed] [Google Scholar]
- [7].Horger M, Claussen C, Kramer U, et al. Very early indicators of response to systemic therapy in lymphoma patients based on alterations in water diffusivity--a preliminary experience in 20 patients undergoing whole-body diffusion-weighted imaging. Eur J Radiol 2014;83:1655–64. [DOI] [PubMed] [Google Scholar]
- [8].Spira D, Grunwald L, Vogel W, et al. Midtreatment evaluation of lymphoma response to chemotherapy by volume perfusion computed tomography. J Comput Assist Tomogr 2014;38:123–30. [DOI] [PubMed] [Google Scholar]
- [9].Spira D, Vogel W, Sokler M, et al. Size and attenuation CT (SACT) of residual masses in patients with follicular non-Hodgkin lymphoma: more than a status quo? Eur J Radiol 2012;81:1657–61. [DOI] [PubMed] [Google Scholar]
- [10].Lubner MG, Smith AD, Sandrasegaran K, et al. CT texture analysis: definitions, applications, biologic correlates, and challenges. Radiographics 2017;37:1483–503. [DOI] [PubMed] [Google Scholar]
- [11].Lister TA, Crowther D, Sutcliffe SB, et al. Report of a committee convened to discuss the evaluation and staging of patients with Hodgkin's disease: Cotswolds meeting. J Clin Oncol 1989;7:1630–6. [DOI] [PubMed] [Google Scholar]
- [12].van Griethuysen JJM, Fedorov A, Parmar C, et al. Computational radiomics system to decode the radiographic phenotype. Cancer Res 2017;77:e104–7. [DOI] [PMC free article] [PubMed] [Google Scholar]
- [13].Yip C, Davnall F, Kozarski R, et al. Assessment of changes in tumor heterogeneity following neoadjuvant chemotherapy in primary esophageal cancer. Dis Esophagus 2015;28:172–9. [DOI] [PubMed] [Google Scholar]
- [14].Henderson S, Purdie C, Michie C, et al. Interim heterogeneity changes measured using entropy texture features on T2-weighted MRI at 3.0 T are associated with pathological response to neoadjuvant chemotherapy in primary breast cancer. Eur Radiol 2017;27:4602–11. [DOI] [PMC free article] [PubMed] [Google Scholar]
- [15].Canellos GP. Residual mass in lymphoma may not be residual disease. J Clin Oncol 1988;6:931–3. [DOI] [PubMed] [Google Scholar]
- [16].Goh V, Ganeshan B, Nathan P, et al. Assessment of response to tyrosine kinase inhibitors in metastatic renal cell cancer: CT texture as a predictive biomarker. Radiology 2011;261:165–71. [DOI] [PubMed] [Google Scholar]
- [17].Cheson BD. New staging and response criteria for non-Hodgkin lymphoma and Hodgkin lymphoma. Radiol Clin North Am 2008;46:213–23. [DOI] [PubMed] [Google Scholar]
- [18].Adams HJA, Kwee TC. Interim FDG-PET/CT in Hodgkin lymphoma: what are we actually looking at? Acta Oncol 2018;57:1128–30. [DOI] [PubMed] [Google Scholar]
- [19].Blake MA, Singh A, Setty BN, et al. Pearls and pitfalls in interpretation of abdominal and pelvic PET-CT. Radiographics 2006;26:1335–53. [DOI] [PubMed] [Google Scholar]
- [20].Castellucci P, Nanni C, Farsad M, et al. Potential pitfalls of 18F-FDG PET in a large series of patients treated for malignant lymphoma: prevalence and scan interpretation. Nucl Med Commun 2005;26:689–94. [DOI] [PubMed] [Google Scholar]


