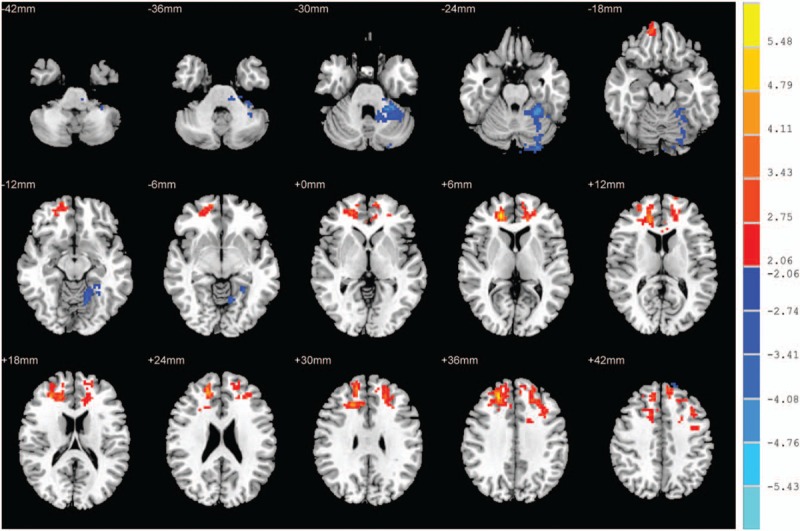
Figure 1.

ReHo alterations in OSAHS group when compared to control group. Significantly increased ReHo values in the superior frontal gyrus dorsolateral, the left middle frontal gyrus, the superior frontal gyrus medial. Significantly decreased ReHo values in the left fusiform gyrus and cerebellum lobule 6. (cluster > 389 voxels, P < .05, AlphaSim corrected). Red indicates ReHo increase; Blue indicates ReHo decrease. OSAHS = obstructive sleep apnea hypopnea syndrome, ReHo = regional homogeneity.
