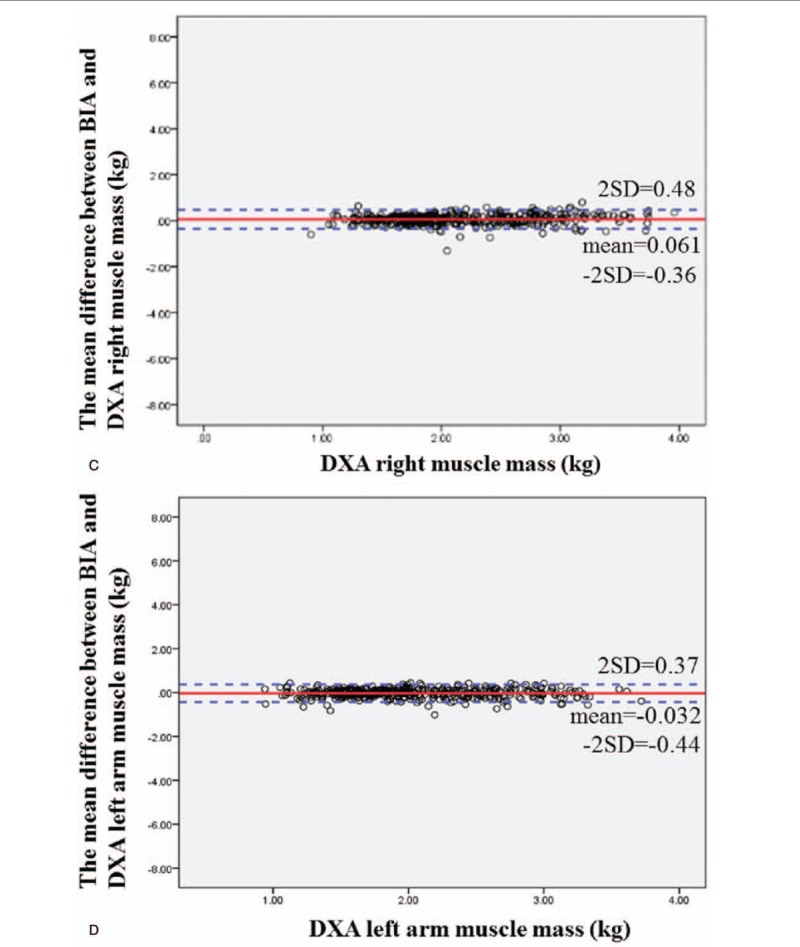
Figure 2 (Continued).

(A) Bland–Altman difference plot for BIA and DXA adipose-derived mass. The mean difference in fat mass between BIA and DXA was 0.0019, and the confidence interval for the two standard deviations was −3.71 to 3.71. The Bland–Altman consistency analysis results showed that BIA tends to underestimate fat mass. However, overall, only <5% of the differences in fat mass between DXA and BIA exceeded ±2 standard deviations, which conforms to the 95% confidence level. Therefore, the fat masses estimated by DXA and BIA are consistent. (B) Bland–Altman difference plot for BIA and DXA muscle mass. The mean difference in muscle mass between BIA and DXA was 0.42, and the confidence interval for the two standard deviations was −3.44 to 4.28. The Bland–Altman consistency analysis results showed that BIA tends to underestimate muscle mass. However, overall, only <5% of the differences in muscle mass between DXA and BIA exceeded ±2 standard deviations, which conforms to the 95% confidence level. Therefore, the muscle masses estimated by DXA and BIA are consistent. (C) Bland–Altman difference plot for BIA and DXA right arm muscle mass. The mean difference in right arm muscle mass between BIA and DXA was 0.061, and the confidence interval for the two standard deviations was −0.36 to 0.48. The Bland–Altman consistency analysis results showed that BIA tends to underestimate the right arm muscle mass. However, overall, only <5% of the differences in muscle mass between DXA and BIA exceeded ±2 standard deviations, which conforms to the 95% confidence level. Therefore, the muscle masses estimated by DXA and BIA are consistent. (D) Bland–Altman difference plot for BIA and DXA left arm muscle mass. The mean difference in left arm muscle mass between BIA and DXA was −0.032, and the confidence interval for the two standard deviations was −0.44 to 0.37. The Bland–Altman consistency analysis results showed that BIA tends to overestimate the left arm muscle mass. However, overall, only <5% of the differences in muscle mass between DXA and BIA exceeded ±2 standard deviations, which conforms to the 95% confidence level. Therefore, the muscle masses estimated by DXA and BIA are consistent. (E) Bland–Altman difference plot for BIA and DXA trunk muscle mass. The mean difference in trunk muscle mass between BIA and DXA was 0.95, and the confidence interval for the two standard deviations was −1.89 to 3.8. The Bland–Altman consistency analysis results showed that BIA tends to underestimate the trunk muscle mass. However, overall, only <5% of the differences in muscle mass between DXA and BIA exceeded ± 2 standard deviations, which conforms to the 95% confidence level. Therefore, the muscle masses estimated by DXA and BIA are consistent. (F) Bland–Altman difference plot for BIA and DXA right leg muscle mass. The mean difference in right leg muscle mass between BIA and DXA was −0.12, and the confidence interval for the two standard deviations was −1.15 to 0.92. The Bland–Altman consistency analysis results showed that BIA tends to overestimate the right leg muscle mass. However, overall, only <5% of the differences in muscle mass between DXA and BIA exceeded ±2 standard deviations, which conforms to the 95% confidence level. Therefore, the muscle masses estimated by DXA and BIA are consistent. (G) Bland–Altman difference plot for BIA and DXA left leg muscle mass. The mean difference in left leg muscle mass between BIA and DXA was −0.18, and the confidence interval for the two standard deviations was −1.26 to 0.91. The mean difference in right leg muscle mass between BIA and DXA was −0.12, and the confidence interval for the two standard deviations was −1.15 to 0.92. The Bland–Altman consistency analysis results showed that BIA tends to overestimate the left leg muscle mass. However, overall, only <5% of the differences in muscle mass between DXA and BIA exceeded ±2 standard deviations, which conforms to the 95% confidence level. Therefore, the muscle masses estimated by DXA and BIA are consistent.
