Figure 2.

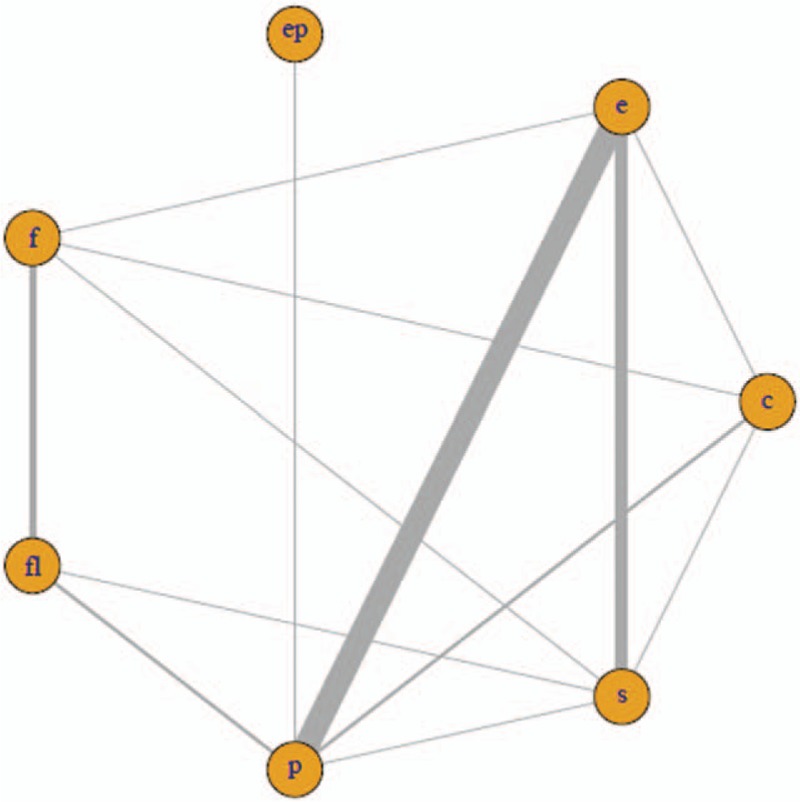
Network plots of SSRIs. The width of the lines represents the total number of trials for each comparison. C indicated Citalopram, F: Fluoxetine, S: Sertraline, P: Paroxetine, E: Escitalopram.

Network plots of SSRIs. The width of the lines represents the total number of trials for each comparison. C indicated Citalopram, F: Fluoxetine, S: Sertraline, P: Paroxetine, E: Escitalopram.