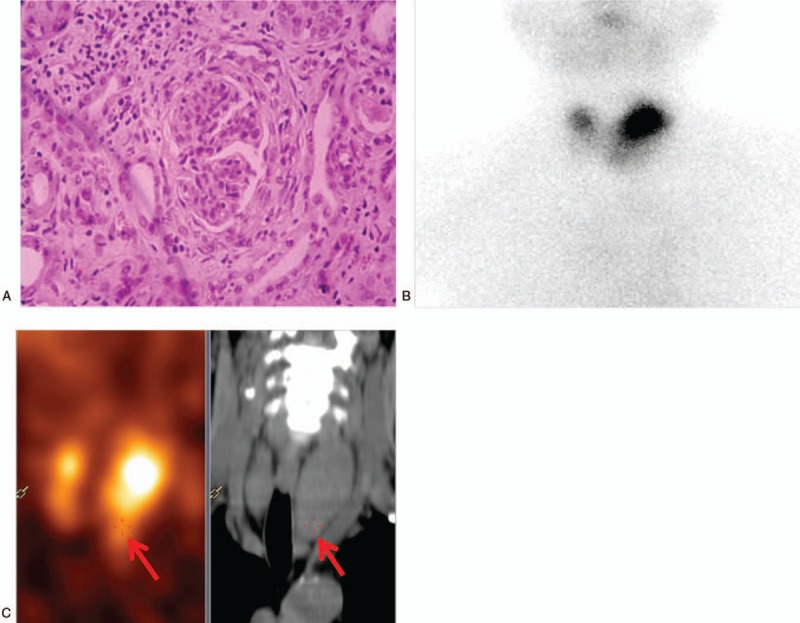
Figure 1.

(A) Renal biopsy (hematoxylin and eosin staining ×200) showing the interstitial and perivascular infiltrate comprising lymphocytes and eosinophils, fibrinoid necrosis, and glomerular, parietal epithelial cell hyperplasia. (B) 99Technetium scan revealing a high tracer uptake in the left upper thyroid. (C) Parathyroid single-photon emission computed tomography/computed tomography fusion image showing a slightly lower density below the left thyroid with a slightly higher concentration of radioactivity (as indicated by the red arrows).
