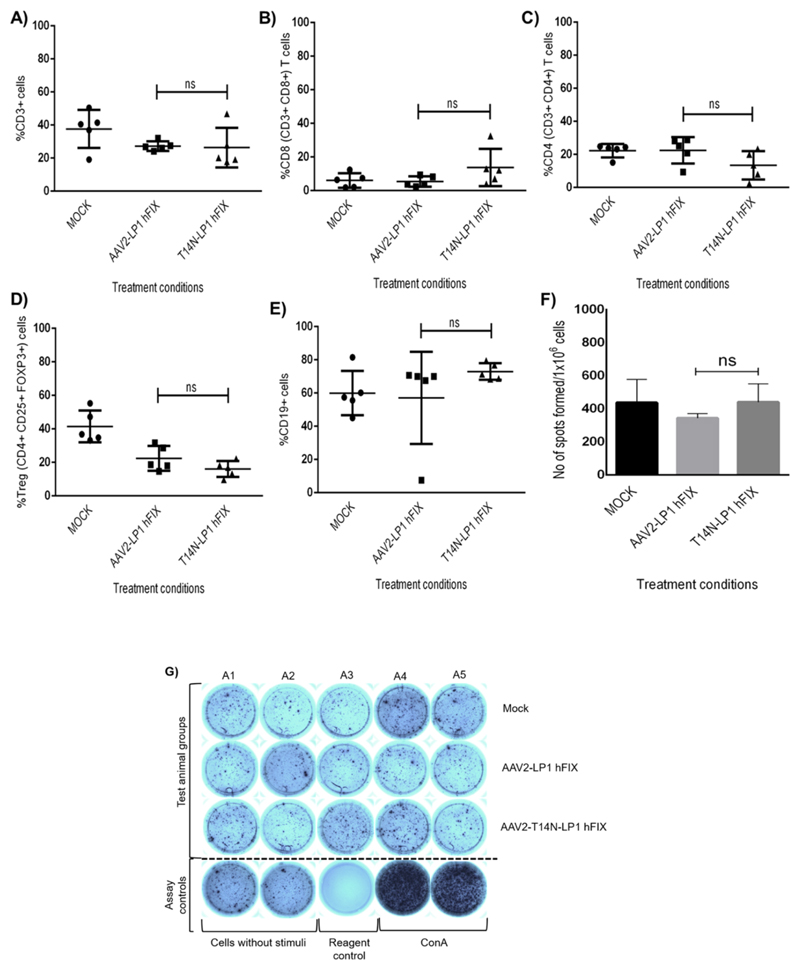
Figure 5.
Evaluation of immune response in hemophilia B mice administered with AAV2-WT or AAV2-T14N mutant encoding human factor (F)IX transgene. Blood samples collected at 12 weeks after hepatic gene transfer was assessed for T-cell and B-cell markers by flow cytometry. Data for CD3+ T lymphocytes (A); cytotoxic T cells (CD3+CD8+) (B); and helper T cells (CD3+CD4+) (C); B-lymphocytes (E) from peripheral blood and regulatory T cells (CD4+CD25+ & FoxP3) in splenocytes (D) from mock-injected or AAV2-injected animals (n = 5) are shown. (F) Number of spots generated by 1 × 10⁶ splenocyte cells stimulated by the AAV2 capsid-specific peptide in the ELISPOT assay. (G) Representative images of the treatment groups, positive controls [concanavalin (Con) A], reagent control (without cells), cells without stimuli as blank controls, in ELISPOT plate are provided below. Data are shown as the mean ± standard deviation of the number of spots obtained from splenocytes seeded in duplicate wells for each of the five mice per group. P values were not significant (p > 0.05) vs WT-AAV2 injected hemophilia B mice.

