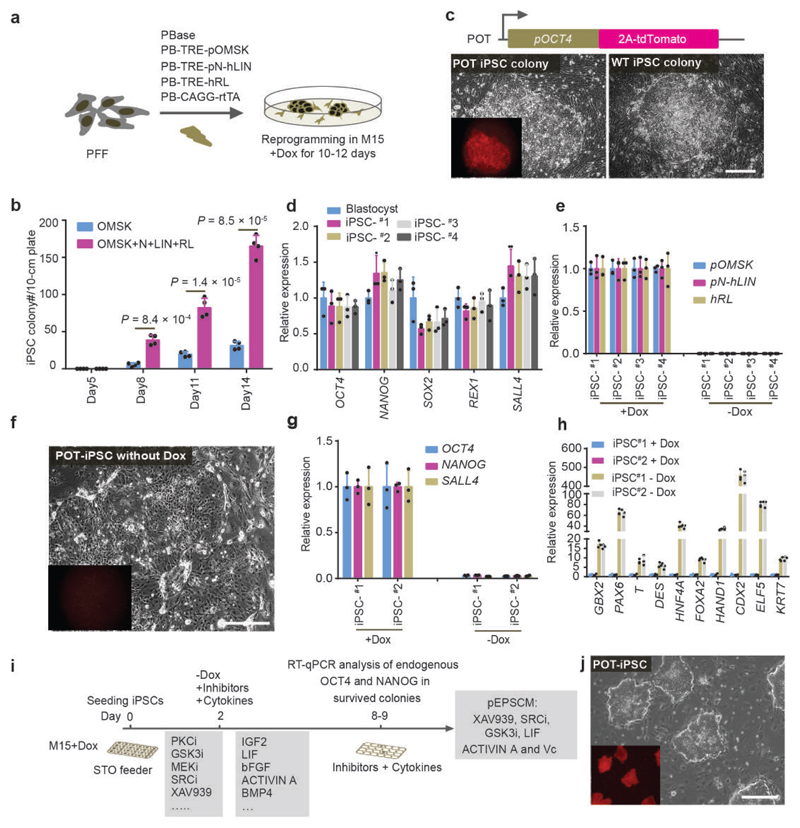
Figure 1. Identification of culture conditions for porcine EPSCs.
a. Doxycycline (Dox)-inducible expression of Yamanaka factors OCT4, MYC, SOX2 and KLF4, together with LIN28, NANOG, LRH1 and RARG in porcine PFFs. Stable genomic integration of cDNAs in PFFs was achieved by piggyBac transposition. pOMSK: Porcine OCT4, MYC, SOX2 and KLF4; pN+hLIN: porcine NANOG and human LIN28; hRL: human RARG and LRH1. The reprogrammed colonies were single-cell passaged in the presence of Dox in M15 (15% fetal calf serum). b. Co-expression of LIN28, NANOG, LRH1 and RARG substantially increased the number of reprogrammed colonies from 250,000 PFFs (n = 4 independent experiments). c. Reprogramming of the porcine OCT4-tdTomato knock-in reporter (POT) TAIHU and wide type (WT) German Landrace PFFs to iPSCs. d. The iPSCs lines expressed key pluripotency genes in RT-qPCR analysis. The iPSC lines #1 and #2, and iPSC #3 and #4 were from WT German Landrace and POT PFFs, respectively. e. RT-qPCR analysis of the exogenous reprogramming factors in iPSCs either in the presence of Dox or 5 days after its removal. f. POT iPSCs became Td-tomato negative 5 days after Dox removal. g. RT-qPCR analysis of the expression of endogenous pluripotency genes in iPSCs cultured with or without Dox. h. Expression of lineage genes in porcine iPSCs 5-6 days after DOX removal. Gene expression was measured by RT-qPCR. Relative expression levels are shown with normalization to GAPDH. Experiments were performed 3 times. i. Diagram depicting the screen strategy for identifying culture conditions for porcine pluripotent stem cells using the Dox-dependent iPSC. Small molecule inhibitors and cytokines were selected for various combinations. Cell survival, cell morphology, and expression of endogenous OCT4 and NANOG were employed as the read-outs. j. Images of OCT4-Tdtomato reporter (POT) iPSCs in pEPSCM without Dox. In all RT-qPCR analysis, n=3 independent experiments. All graphs represent the mean ± s.d. P values were computed using a two-tailed t-test. For c, f and j, the experiments were repeated independently three times with similar results. Source data are provided in Supplementary Table 1. Scale bars, 100 μm.

