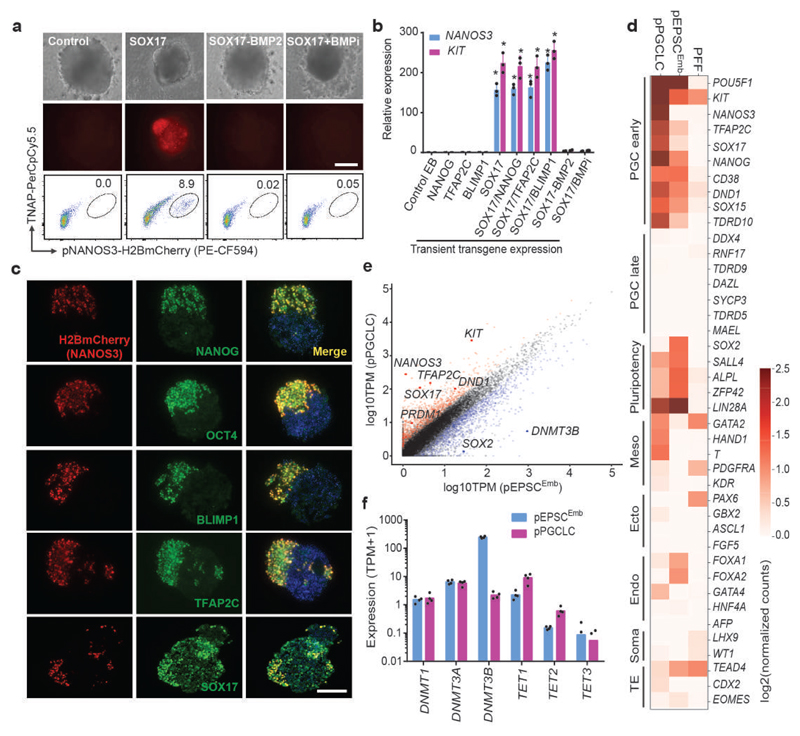
Figure 3. In vitro generation of PGC-like cells from pEPSCsEmb.
a. Induction of pPGCLC by transiently expressing SOX17 in NANOS3-H2BmCherry reporter pEPSCs. The presence of H2BmCherry+TNAP+ cells in embryoid bodies (EBs) was analysed by FACS. The experiments were repeated independently three times with similar results. b. RT-qPCR analysis of PGC genes in day 3 EBs following pPGCLC induction. Relative expression levels werenormalized against GAPDH. n=3 independent experiments. Data are mean ± s.d. P values were calculated using a two-tailed t-test. Statistical source data are provided in Supplementary table 10. c. Immunofluorescence analysis of PGC factors in the sections of EBs at day 3-4 following pPGCLC induction. The H2BmCherry+ cells co-expressed NANOG, OCT4, BLIMP1, TFAP2C and SOX17. DAPI stained nuclei. Experiments were performed three times. d. RNAseq analysis (Heat map) of sorted H2BmCherry+ of pPGCLC induction shows expression of genes associated with PGCs, pluripotency or somatic lineages (mesoderm, endoderm, and gonadal somatic cells). e. Pair-wise gene expression comparison between pEPSCsEmb and pPGCLCs. Key up-regulated (red) and down-regulated (blue) genes are highlighted. f. Bar plot shows expression of genes related to DNA methylation in pPGCLCs and the parental pEPSCsEmb. Data were from RNAseq of sorted H2BmCherry+ of pPGCLC induction. Scale bars, 100 μm.

