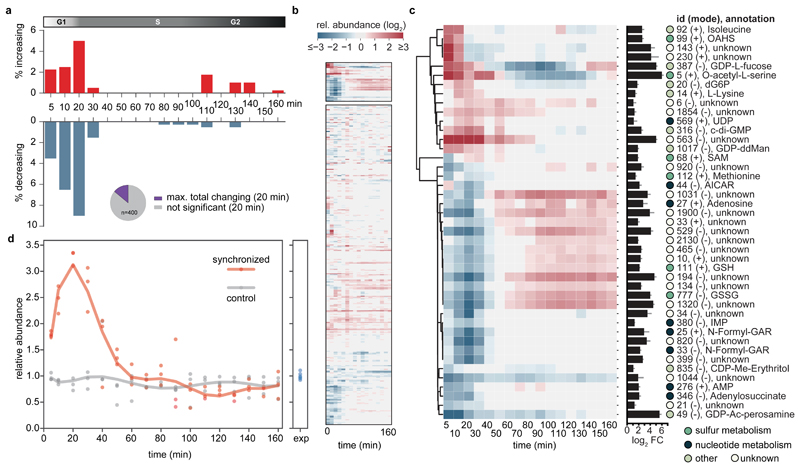
Figure 2. Global metabolic response to cell cycle progression.
(a) Fraction of metabolites over time (total of 400) that significantly increased (red) or decreased (blue) during cell cycle progression of synchronized compared to asynchronous C. crescentus cultures. Inlet pie chart shows the maximal cell cycle dependent response as observed at 20 min upon peak G1-S transition (~14 % of putative metabolites). (b, c) Metabolic signature of cell cycle progression. Cluster maps displaying the changes of metabolite abundances over time post synchronization. Hierarchical clustering (cosine distance matrix, single method agglomeration) of the relative abundance profiles of metabolites is shown (log2 fold-change of synchronized over control cultures). Overall, metabolism remains largely homeostatic as a function of a cell cycle (b, bottom). Instead, a fraction of metabolites strongly responded to cell cycle progression (b, top, enlarged in c). The bar chart depicts the maximal change of pool size (log2 fold change of minimum over maximum response). The circles next to compounds are colored according to the indicated metabolic identifiers. (d) Relative abundance profiles of mean c-di-GMP levels over time for synchronized (red) or control cultures (grey); n=3 biological replicates per condition. Data was normalized to indicated levels of exponentially ("exp") growing pre-cultures (n=6). Non-canonical abbreviations: OAHS, O-acetyl-L-homoserine; GDP-ddMan, GDP-4-dehydro-6-deoxy-D-mannose; CDP-Me-Erythritol, 4-CDP-2-C-methyl-D-erythritol; GDP-Ac-perosamine, GDP-N-acetyl-alpha-D-perosamine.

