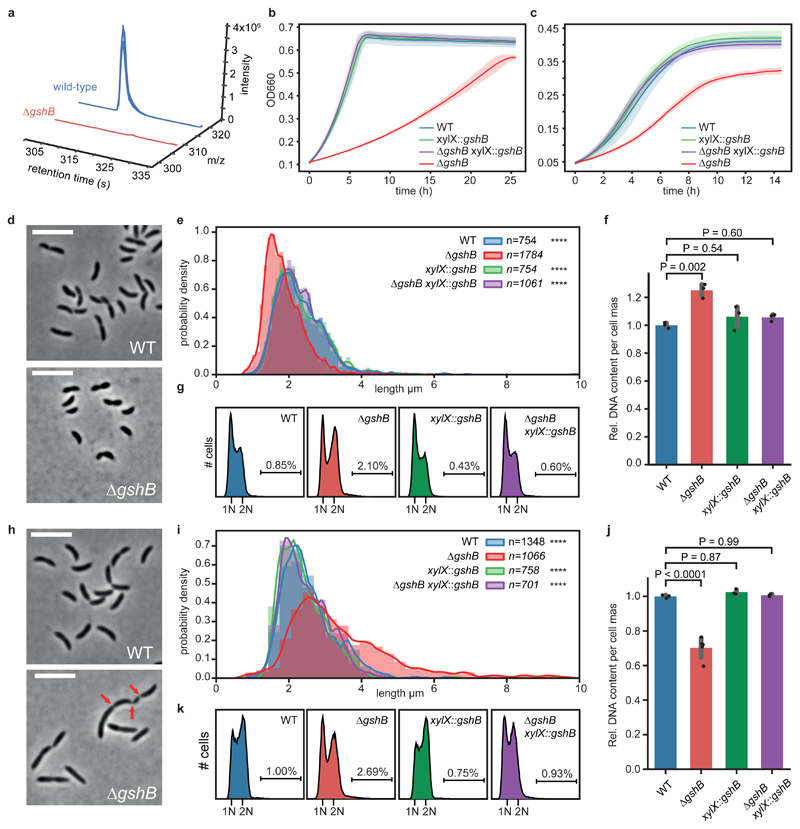
Figure 4. Loss of glutathione decouples growth from cell cycle progression.
(a) Knock-out strain of glutathione synthetase (ΔgshB) is devoid of reduced glutathione. Extracted ion chromatograms of reduced glutathione from ΔgshB cells (red traces, u-12C signals) vs. a spiked wild-type extract (blue traces, u-13C signals); n=3 biological replicates. For data on oxidized glutathione see Supplementary Fig. 13. (b, c) ΔgshB grown on M2G (b) and PYE (c) display growth defects; both were complemented by a copy of gshB (mean values +/- SD; n=3 biological replicates). (d, e) Reduced cell length of ΔgshB cells grown on M2G. Histograms of probability densities display cell length distributions; outlines show a fitted kernel estimate. Number of cells (n) per genotype and statistics (one-way ANOVA with a Kruskal-Wallis test of ΔgshB compared to controls; Dunn's multiple testing correction was applied) as indicated; n=4 biological replicates per genotype; ****P < 0.0001. (f) Relative DNA content per cell mass of M2G grown cells as estimated by flow cytometry. Mean values +/- SD of n=3 biological replicates. For statistical analysis, one-way ANOVA followed by multiple comparison analysis (MCA; Tukey) was performed. (g) Replication activity of M2G grown ΔgshB cells compared to controls from n=3 biological replicates per genotype as determined by flow cytometry. Chromosome equivalents (N) are depicted, and fractions of cells with more than 2N are indicated. (h, i) Mutant cells show aberrant cell morphology, increased cell body length and broadened distribution on complex media (PYE); data was reproduced with n=4 biological replicates per genotype. Data analysis, statistics like in (e); **** P < 0.0001. Red arrows indicate partial constrictions of a filamented cell. Cells larger >10 μm are not shown; examples are depicted in Supplementary Fig. 14. (j) Relative DNA content per cell mass of PYE grown cells. Mean values +/- SD of n=5 (ΔgshB) or n=3 (all other) biological replicates. Statistics like in (f) with one-way ANOVA followed by MCA (Tukey). (k) Replication activity of PYE grown biological replicates of ΔgshB cells (n=5) compared to controls (n=3 per genotype). For explanations, see (g). Cell body length was estimated using MicrobeJ78. Microscopy scale bar is 5 μm.

