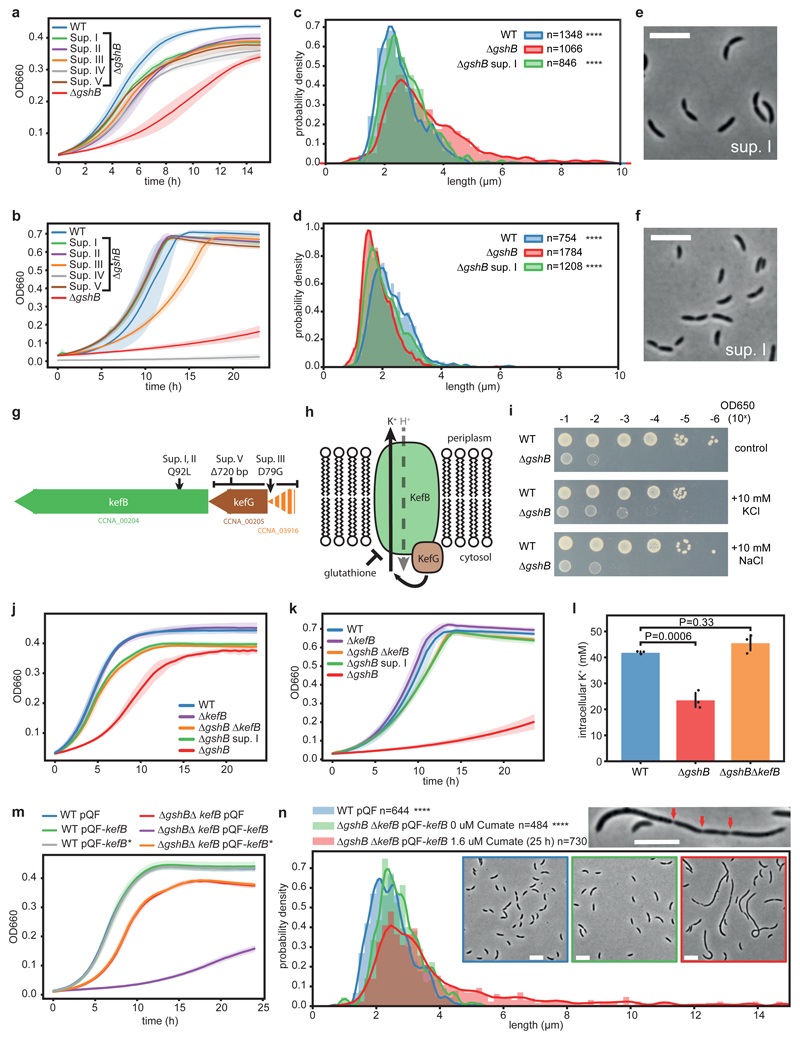
Figure 5. Lack of glutathione leads to kefB-dependent cell division defects.
(a, b) Suppressors (I-V) improve growth of ΔgshB on PYE (a) and except for sup. IV, a sulfur assimilation mutant, see main text, on M2G (b). (c-f) Sup. I improves cell morphology of ΔgshB cells on PYE (c,e) and M2G (d,f). Corresponding data for all suppressors is shown in Supplementary Fig. 17. Distributions of wild-type and ΔgshB are from Fig. 4; for explanations, see corresponding caption. All data and statistics (one-way ANOVA with a Kruskal-Wallis test of ΔgshB compared to controls with Dunn's multiple testing correction) based on n=4 biological replicates; ****P < 0.0001. (g) ΔgshB suppressor strains have mutations around the kefB locus. (h) Schematic representation and regulation of the predicted KefB K+/H+ antiporter. (i) Serial dilutions of ΔgshB and wild-type cells grown on PYE alone, or supplemented with 10mM KCl, NaCl. The experiment was independently performed twice with similar results. (j, k) Deletion of kefB in a ΔgshB background (ΔgshBΔkefB) suppresses ΔgshB growth defects on PYE (j) and M2G (k). (l) Intracellular potassium concentrations of cells grown on PYE media as determined by ICP-MS. ΔgshB displays reduced intracellular K+ levels compared to wild-type and ΔgshBΔkefB cells. Mean values +/- SD of n=3 biological replicates are shown. Statistical analysis was done using a one-way ANOVA followed by multiple comparison analysis (Tukey). (m) Induction of kefB with cumate impairs growth on PYE in ΔgshBΔkefB cells complemented with wild-type kefB, while kefB-Q92L has no effect. All cultures were grown in presence of 100 μM cumate. (n) Modest induction of kefB by 1.6 μM cumate in ΔgshBΔkefB cells leads to increased cell body length and cell division defects on PYE media. For explanations, see Fig. 4e. Data from n=3 biological replicates. Statistics was done with one-way ANOVA with a Kruskal-Wallis test of induced vs. control cultures using Dunn’s multiple testing correction; ****P < 0.0001. Cells larger >15 μm are not plotted. Zoom-in displays a representative elongated cell; arrows indicate partial cell constrictions. All growth curves show mean values +/- SD of n=3 biological replicates; pQF, empty plasmid; pQF-kefB, wild-type kefB; pQF-kefB*, kefB-Q92L. Microscopy scale bar is 5 μm.

