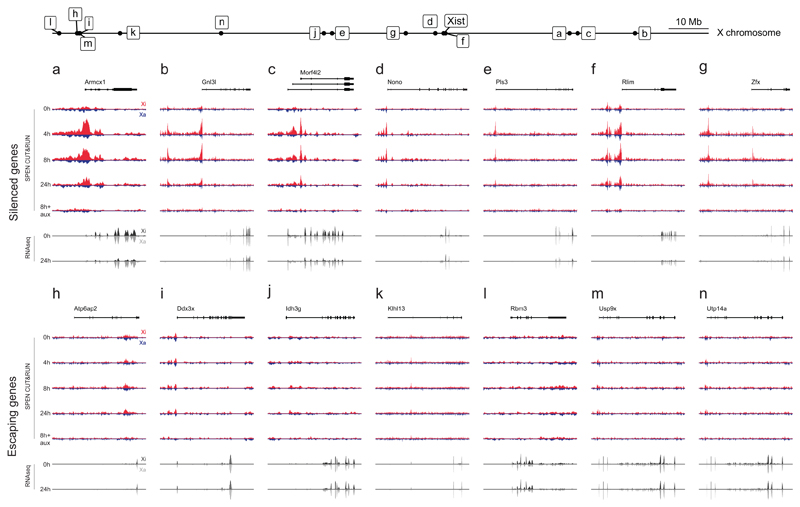
Extended Data Figure 5. Genome browser allelic tracks of SPEN binding and transcript expression at X-linked genes.
a-n, Top of each pannel: Genome brower allelic tracks of SPEN binding (CUT&RUN) at (a-g) silenced genes and (h-n), non-silenced genes, during a timecourse of Xist induction in mESCs (Cast-Xa in blue, B6-Xi in red, scaled identically within each pannel). Bottom of each pannel: Allelic tracks of transcript expression (RNAseq) at 0h and 24h of Xist induction in mESCs (Cast-Xa in light grey, B6-Xi in black, scaled identically within each pannel). Relative position of each gene along the X chromosome is shown at the top of the figure.

