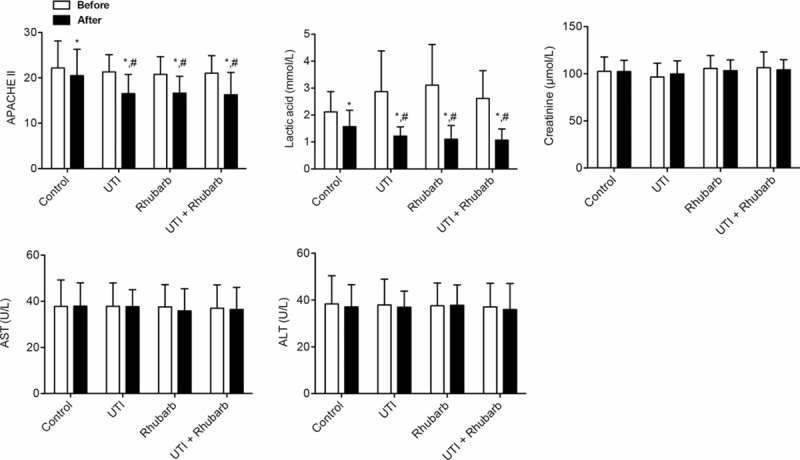
Figure 2.

APACHE II score, tissue perfusion, and liver and kidney function. ∗P < .05, compared with the same group before treatment; # P < .05, compared with control group after treatment.

APACHE II score, tissue perfusion, and liver and kidney function. ∗P < .05, compared with the same group before treatment; # P < .05, compared with control group after treatment.