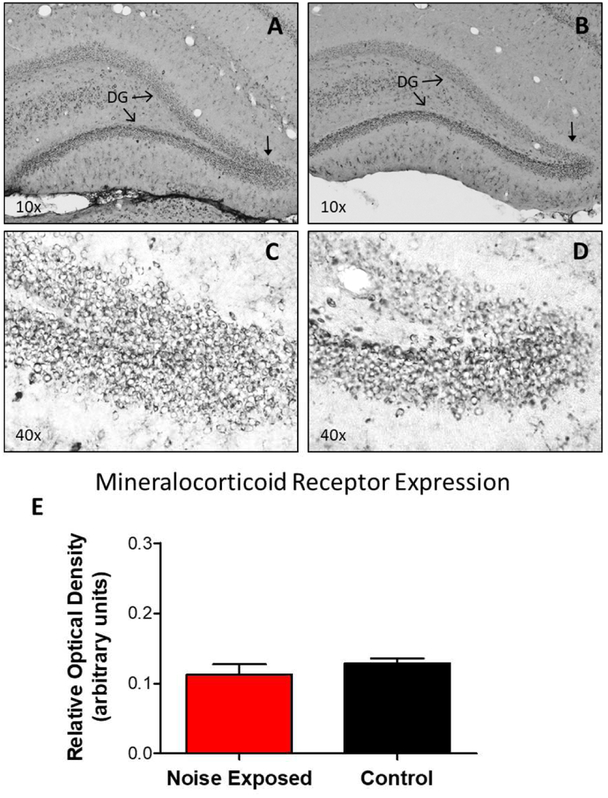
Figure 7:
Representative photomicrographs of hippocampal mineralocorticoid receptor (MR) expression in noise-exposed (A, C) and control (B, D) rats. Cells immunopositive for MR can be seen spanning the length of the hippocampal dentate gyrus (DG). The arrows in panels A and B mark the location of the higher magnification images in panels C and D. No significant difference was observed in MR expression between noise-exposed and control animals (E; two-tailed t-test, p > 0.05). Data represent mean ± SEM.

