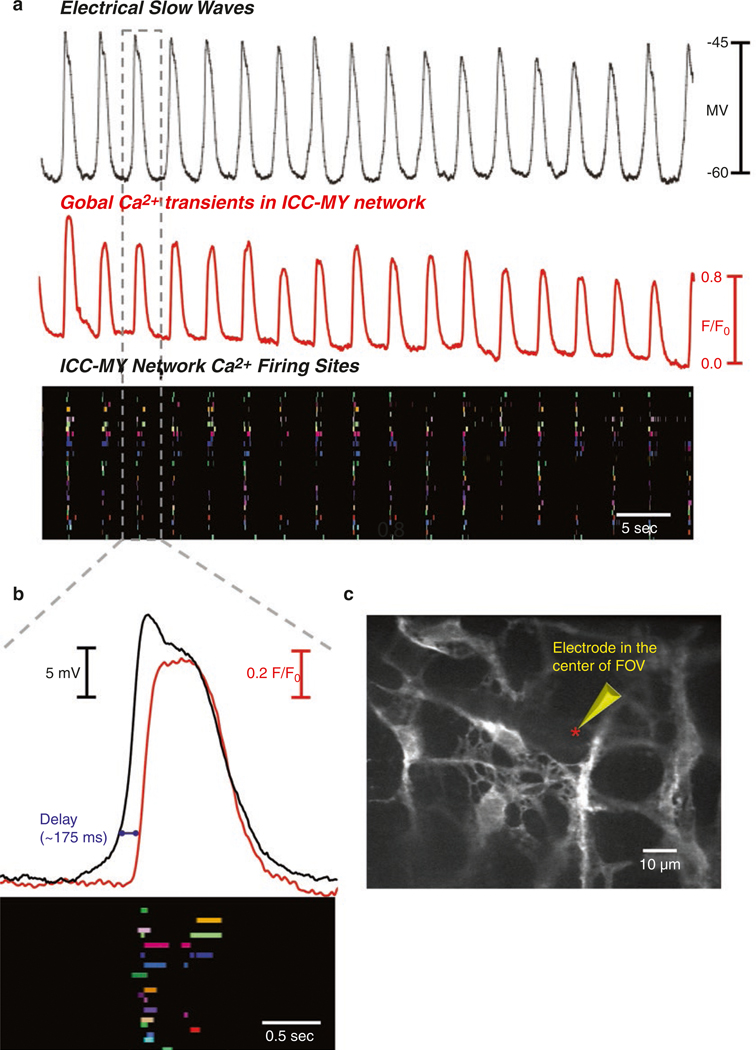
Fig. 1.11.
Ca2+ clusters in ICC-MY during slow wave activity. (a) Slow waves and Ca2+ waves in ICC-MY networks recorded simultaneously from jejunum muscle from a mouse expressing GCaMP3 exclusively in ICC. Imaging performed with a confocal microscope to restrict view to ICC-MY. Note the one-to-one relationship between the slow waves and Ca2+ transients. If fact the waves were not smooth changes in global Ca2+ observed in lower resolution monitoring. When higher resolution was used, facilitated by the superior performance of GCaMP3 as a sensor and low background from restricting GCaMP3 expression to ICC, Ca2+ waves were seen to be composed of many localized Ca2+ transients occurring in different sites within cell soma and processes. Each firing site was assigned a color and these are plotted in the occurrence map (third panel in a). Mapping Ca2+ transients in this manner shows that the transients are temporally clustered together at the frequency of the slow waves. (b) Increased sweep speed of simultaneous Ca2+ transient and slow wave outlined by gray box in (a). The occurrence map from this slow wave cycle is shown beneath the traces. Each Ca2+ firing site in the FOV was assigned a different color, and this analysis shows that Ca2+ transients occurred with different delays after the initiation of the slow wave upstroke, the durations of Ca2+ transients was highly variable, and multiple events occurred from the same site on occasion. Note that the Ca2+ clusters begin with a slight delay after the upstroke of the slow wave, and all occur within the duration of the slow wave. These observations suggest that the duration of the slow wave plateau depolarization is determined by the spread in time of Ca2+ transients, as the open probability of Ano1 channels (causing depolarization) will continue to be elevated as long as Ca2+ release events persist. (c) Shows ICC-MY network and site of recording within the FOV and within a few μM from the cells being imaged. Copied with permission from [157]

