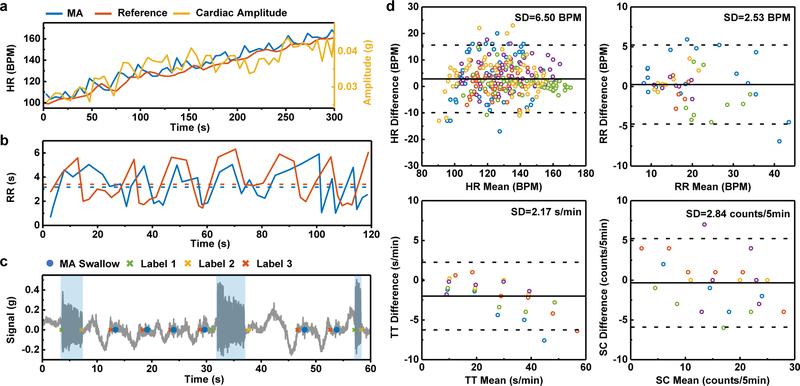
Fig. 4 |. Results from mechano-acoustic (MA) data recorded at the suprasternal notch (SN) in field studies with comparisons to reference measurements.
a, HR measurements during a 5-minute interval during exercise to increase the HR using MA signals and a Polar® hand-grip monitor. The cardiac amplitude, measured as the peak acceleration amplitude, exhibits a correlation with the HR measurement. b, RR measurements during a 2-minute interval using MA data and manual counting. The subject counts peak-to-peak intervals but the algorithm counts zero-to-zero intervals, thereby leading to a difference that appears as a time lag. c, A sample 1-min dining-scheme experiment comparing the reference labeling of events (cross) with the MA device detection (dot). For reference labels, label 1 and 2 mark the start and end of talking, while label 3 marks the occurrence of swallowing. d, The Bland Altman analysis for HR, RR, TT and SC. The solid and dashed lines represent mean difference and standard deviation × 1.96, respectively. Different colours represent the five different healthy normal subjects.

