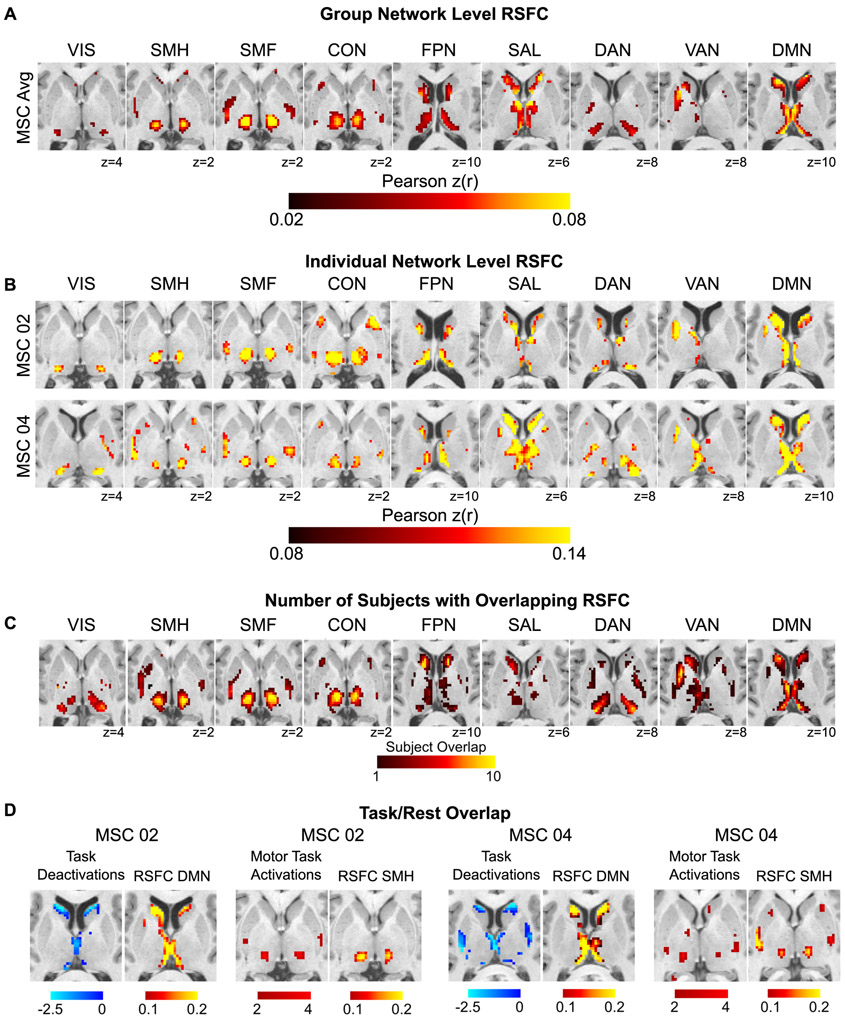
Figure 2. Subcortical RSFC is measurable at the individual level.
(A) Group-averaged subcortical RSFC for each cortical network. (B) Individual-level subcortical RSFC for each network from two representative MSC subjects, one male (MSC02) and one female (MSC04) (see Fig. S2 for all ten subjects). (C) Subject overlap showing the number of subjects with strong (top 10%) correlations with each network at that voxel. (D) Concordance between RSFC and task activations/deactivations within individuals. Task-evoked increases in BOLD activity during a motor task converge with peak RSFC in the somatomotor hand network. Task-evoked deactivations during a set of cognitive/perceptual tasks converge with peak RSFC in the default-mode network. Anatomical left is image left. VIS = visual; SMH = somatomotor hand; SMF = somatomotor face; CON = cingulo-opercular network; FPN = frontoparietal network; SAL = salience; DAN = dorsal attention network; VAN = ventral attention network; DMN = default-mode network.

