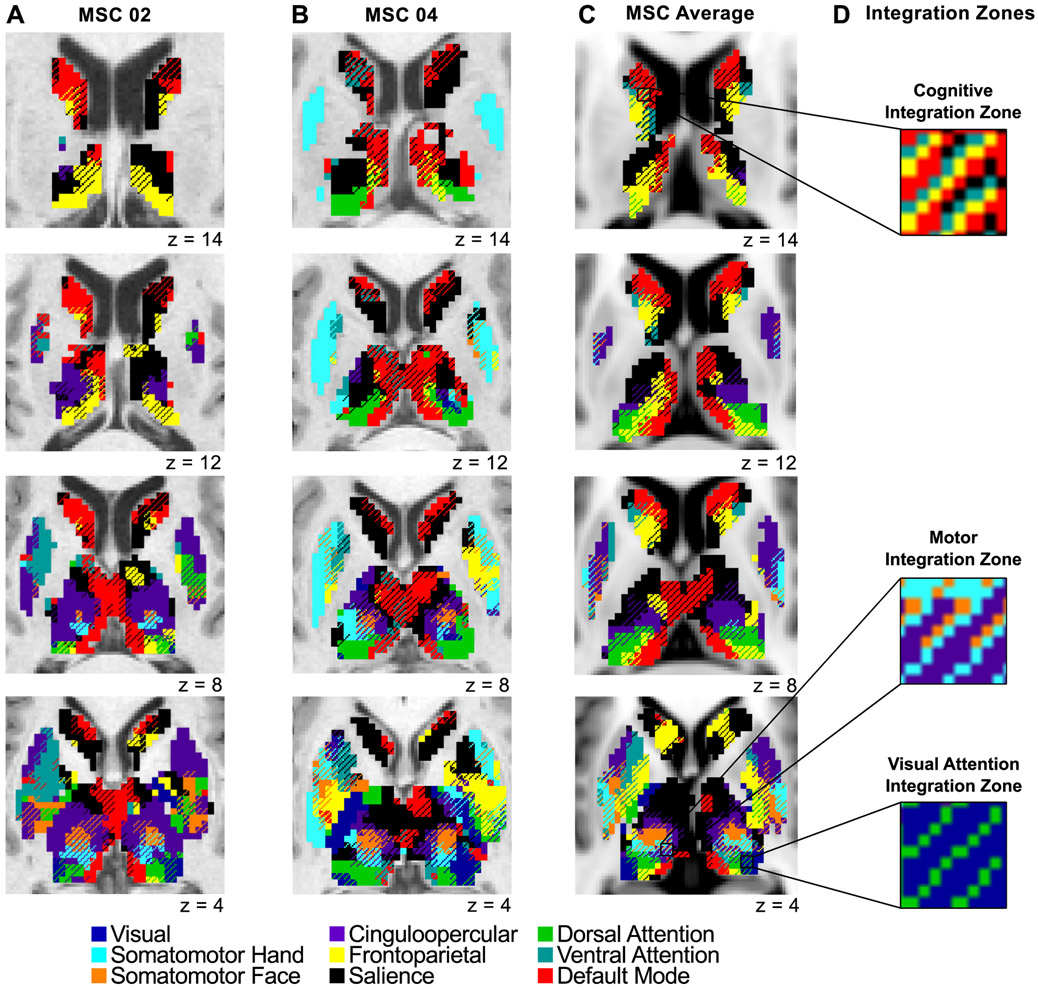
Figure 3. Network-specific and integrative functional zones in the basal ganglia and thalamus.
Data displayed for (A) one male representative subject (MSC02), (B) one female representative subject (MSC04), and (C) the group average (all subjects shown in Fig. S7). Voxels with preferential RSFC to one network (network-specific) are represented by solid colors, and voxels functionally connected to multiple networks (integrative) are represented by cross-hatching. Anatomical left is image left. (D) Zooming in on several integration zones; three distinct clusters of integration zones (see Fig. 5): cognitive integration zones, motor integration zones, and visual attention integration zones.

