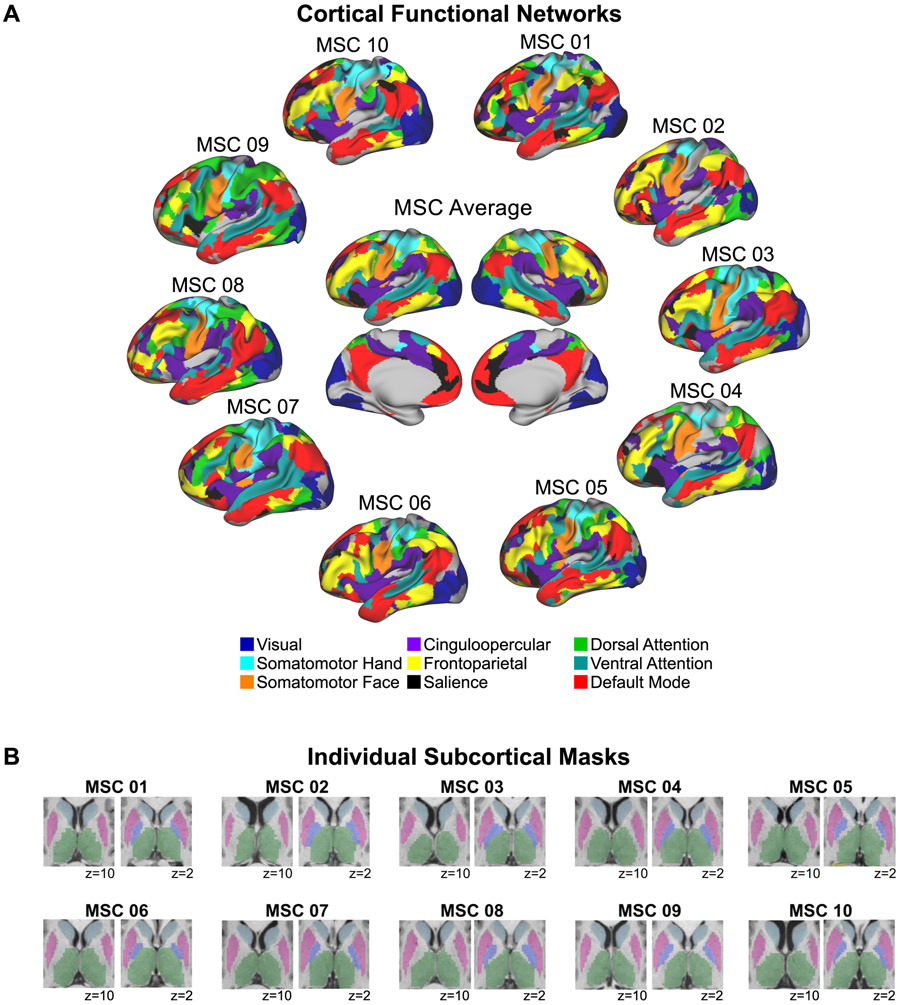
Figure 8. Functional cortical networks and subcortical voxels for each individual.
(A) Individually-defined functional networks (defined as in Gordon et al., 2017) and the group average functional networks are shown. Nine previously well-characterized functional networks were selected in order to investigate cortico-subcortical functional connectivity involving cortical networks that are described consistently using different methods and by multiple investigator groups (e.g., Damoiseaux et al., 2006; Gordon et al., 2016; Power et al., 2011; Yeo et al., 2011). Uncolored regions correspond to vertices that were not part of these nine networks according to the InfoMap network assignments. Note that including all 15 InfoMap networks (excluding unassigned and medial temporal vertices) did not change the results. (B) Subcortical masks from Freesurfer and manually edited using Freeview are shown for each individual. Light blue = caudate; pink = putamen, violet = pallidum; green = thalamus.

