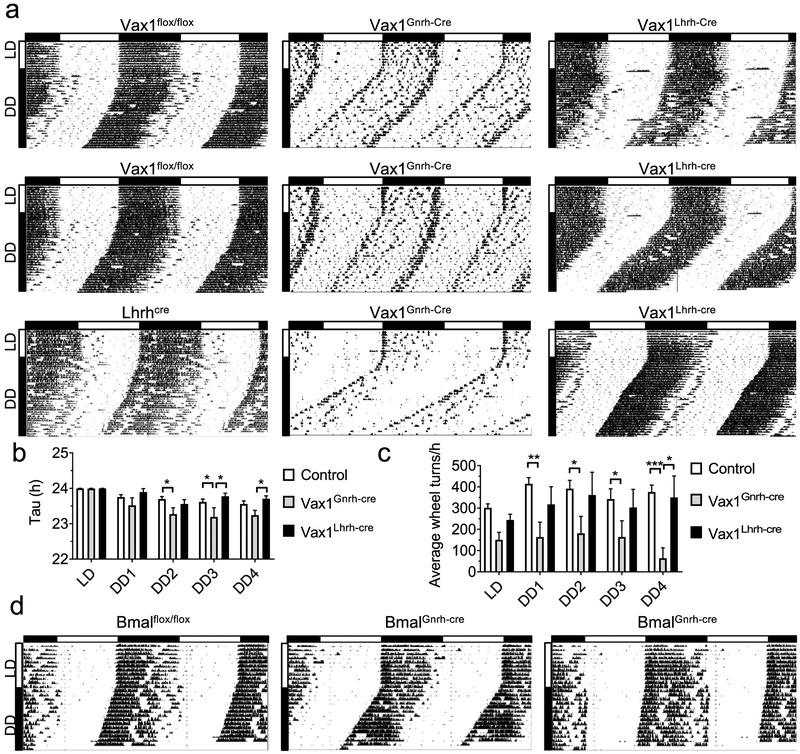
Fig. 4. Ectopic expression of Gnrhcre in the SCN disrupts SCN output in Vax1Gnrh-cre mice.
a Running-wheel patterns in controls (Vax1flox/flox and Lhrhcre), Vax1Gnrh-cre, and Vax1Lhrh-cre females (n=8–10), and d in Bmalflox/flox and BmalGnrh-cre males (n=4). Actograms show double plotted data, expressed as percentage, with 10 days in LD12:12 (LD) followed by (a) 28 days, or (d) 14 days in constant darkness (DD). Horizontal bar above the actograms indicates lights on (white) and lights off (black) during the LD12:12 cycle. b) Seven day average free-running periods (Tau) as established by Chi-square (ClockLab) and c average wheel-revolutions per hour for 7 days of data during LD, week one on DD (DD1), until week four in DD (DD4). Statistical analysis by Two-way ANOVA followed by a Tukey’s multiple comparison, * p<0.05; ** p<0.01, *** p<0.001.

