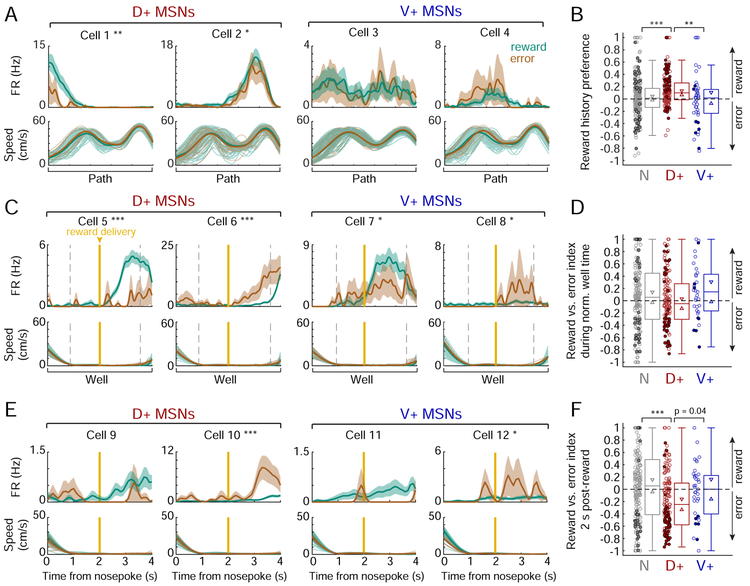
Figure 5. Selective encoding of past reward outcome on the path in the dH-NAc network.
(A) Example path firing patterns of D+ and V+ MSNs as a function of normalized time and split by reward history (outcome of the previous trial). Top: firing rate (mean ± s.e.m. across trials) on all paths following a reward (teal) vs. an error (brown). Cell numbers do not correspond to previous figures. Reward history preference: Cell 1: 0.52, Cell 2: 0.15, Cell 3: 0.018 (p=0.81), Cell 4: −0.26 (p=0.053). *p<0.05, **p<0.01 (permutation test). Bottom: faded lines indicate speed profiles of individual paths following reward and error, thick lines indicate mean speeds.
(B) Reward history preference by SWR-modulation category. Filled circles indicate significantly reward-preferring (>0) or error-preferring (<0) cells, open circles indicate non-significant cells. The D+ population (n=159 cells) is significantly shifted positive of zero (p=6.00×10⁻¹¹, one-tailed signed-rank test). N (n=235 cells) vs. D+: ***p=1.29×10⁻⁴; D+ vs. V+ (n=45 cells): **p=0.003 (Wilcoxon rank-sum tests).
(C) Example well firing patterns of D+ and V+ MSNs as a function of normalized time on rewarded vs. error well visits (mean ± s.e.m. across trials). Format as in (A). Gold vertical line marks actual or expected reward delivery time. Reward vs. error index: Cell 5: 0.65, Cell 6: - 0.69, Cell 7: 0.21, Cell 8: −0.48. *p<0.05, ***p<0.001 (permutation test within the time period flanked by dotted grey lines, when both rewarded and error mean speeds are <2 cm/s).
(D) Reward vs. error index during normalized well time, by SWR-modulation category. Similar to (B). N n=188 cells, D+ n=131 cells, V+ n=33 cells.
(E) Examples well firing patterns of D+ and V+ MSNs as a function of time since nosepoke. Format as in (C). Reward vs. error index: Cell 9: 0.60 (p=0.093), Cell 10: −0.69, Cell 11: 0.77 (p=0.22), Cell 12: −0.48. *p<0.05, ***p<0.001 (permutation test in the 2-4 s window).
(F) Reward vs. error index during 2 s following reward delivery time, by SWR-modulation category (N n=196 cells, D+ n=147 cells, V+ n=37 cells). The D+ population is significantly shifted negative of zero by this metric (p=9.05×10⁻⁷, one-tailed signed-rank test). D+ vs. N: ***p=1.85×10⁻⁵ (Wilcoxon rank-sum test).
See also Figure S7.

