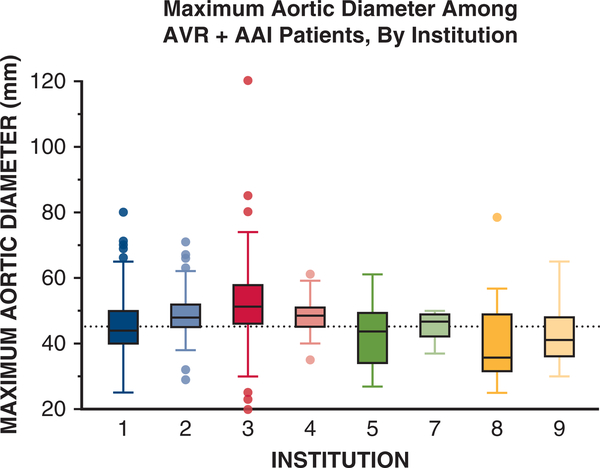
FIGURE 3.
Maximum aortic size at the time of aortic valve replacement plus ascending aortic intervention (AVR+AAT) by institution. Institutions are presented in decreasing order of patients treated. Boxes represent median and interquartile range for aortic diameter at the time of AVR+AAI by institution. Reference line represents 45 mm on the y-axis. For boxes, the midline represents the median value, upper and lower box edges represent the upper and lower interquartile range, respectively. Whiskers represent maximum and minimum values of nonoutliers and additional data points represent outliers. Nine of 18 contributing institutions were included because they contributed more than 95% of patient data (2767 out of 2861) for this study. Institution 6 is missing because all reported cases from this institution were either isolated AVR or isolated AAI.

