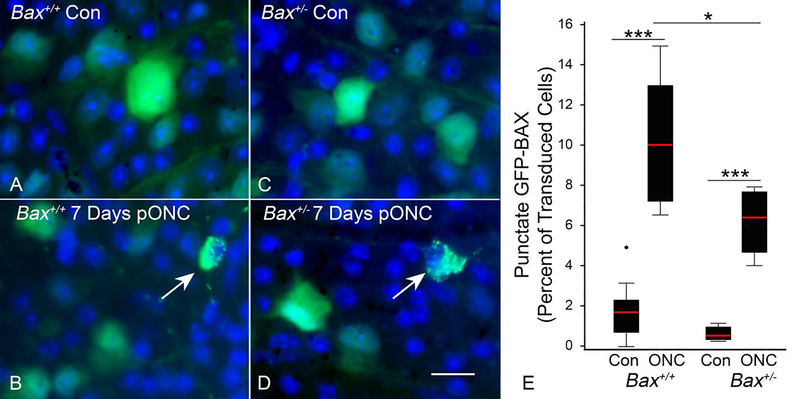
Figure 3: The apoptotic susceptibility of RGCs is determined by BAX dosage.
(A,C) Representative images of AAV2/2-Pgk-GFP-Bax transduced cells in the contralateral (Con) eye of a Bax+/+ and Bax+/− mouse, respectively. Images are of DAPI stained, whole-mounted retinas (B,D) Representative images of transduced cells in the eye 7 days post optic nerve crush (pONC) in a Bax+/+ and Bax+/− mouse, respectively. Arrows point to cells with punctate GFP-BAX localization. Size bar = 20 μm. (E) Box and whisker plots illustrating the percentage of GFP-BAX labeled cells that exhibit punctate localization of GFP-BAX in Bax+/+ and Bax+/− genotypes after ONC. P values were calculated using a one sided t test, assuming equal variance between groups. Both genotypes exhibited significantly more cells with punctate GFP-BAX in the eyes that received ONC (relative to Con eyes), while significantly more cells were punctate in Bax+/+ mice compared to Bax+/− mice. *P<0.05, ***P<0.001. N = 10 mice for Bax+/+ and 5 mice for Bax+/−. An average of 226 and 280 GFP-BAX transduced cells were counted for each Bax+/+ and Bax+/− retina, respectively.

