. 2019 Nov 7;267(3):607–615. doi: 10.1007/s00415-019-09615-3
© The Author(s) 2019
Open AccessThis article is distributed under the terms of the Creative Commons Attribution 4.0 International License (http://creativecommons.org/licenses/by/4.0/), which permits unrestricted use, distribution, and reproduction in any medium, provided you give appropriate credit to the original author(s) and the source, provide a link to the Creative Commons license, and indicate if changes were made.
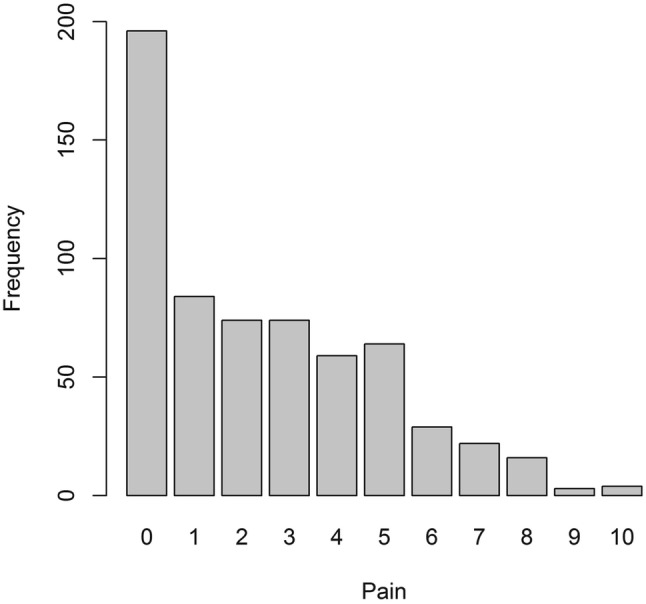
Fig. 1.

A bar chart showing the responses to the pain numerical rating scale
