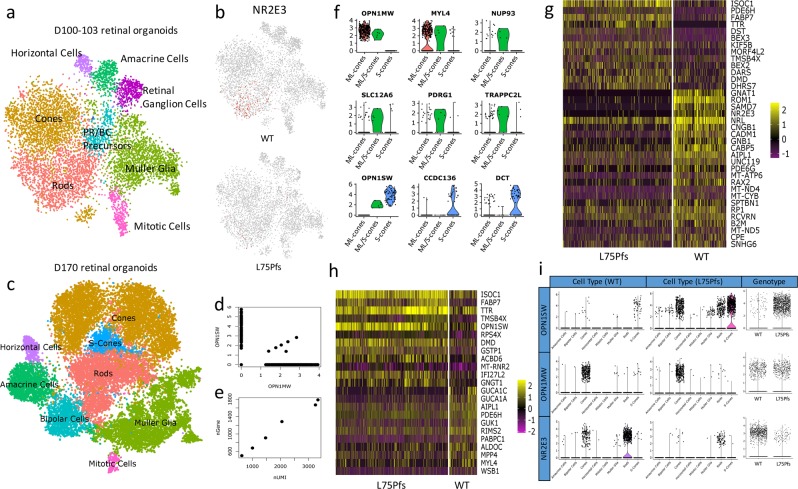
Fig. 4. Identification and characterization of cell populations present in WT and L75Pfs retinal organoids by scRNAseq.
a tSNE plot showing cell populations present in all d100 organoids. b Expression of NR2E3 in WT (top) compared to L75Pfs (bottom) cells, showing that nearly all expression is in WT cells. c tSNE plot showing cell populations present in all d170 organoids. d Scatter plot of OPN1SW and OPN1MW expression at d170 indicating six co-expressing cells. e Scatter plot showing the number of UMIs and genes expressed by the six co-expressing cells from D. f Violin plots showing specific enrichment of novel cone marker genes across WT ML-cones, ML/S-cones, and S-cones. g, h Heatmap of genes differentially expressed in d170 rod (g) and S-cone (h) clusters between WT and L75Pfs cells. i Comparison of expression of OPN1SW, OPN1MW, and NR2E3 by cell population of WT and L75Pfs organoids, and total expression of OPN1SW, OPN1MW, and NR2E3 within all WT and L75Pfs cells.

