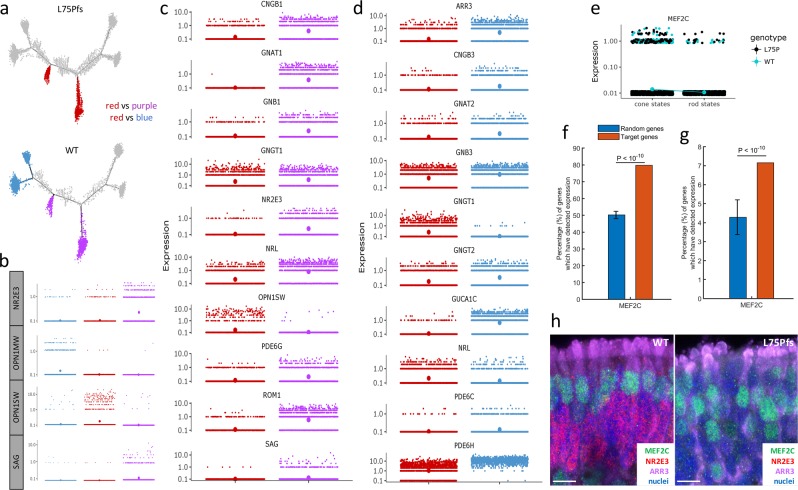
Fig. 7. Comparative analysis of L75Pfs photoreceptors identifies 2 populations of S-opsin expressing photoreceptors, with one population having gene expression inconsistent with WT S-cones, and identification of MEF2C as a candidate regulator of cone cell fate specification.
a Plot depicting the differential expression analysis. Gene expression in the cells highlighted in red (L75Pfs rod-like cells) was separately compared to expression in the cells highlighted in blue (WT cones) and the cells highlighted in purple (WT rods). b Expression levels of NR2E3, OPN1MW, OPN1SW, and SAG across the three cell groups (red, blue, and purple) used for differential analysis. c, d Expression levels of rod- and cone-specific genes differentially expressed between L75Pfs rod-like cells and WT rods (c), or WT cones (d). The position of the largest dots indicate average gene expression levels for b–e. Expression level of MEF2C in cells in the cone states (5 and 6) on the left versus the rod states (7 and 8) on the right, with cells colored by genotype (black = L75Pfs, teal = WT). f, g Percentage of MEF2C-regulated genes expressed in a minimum of 10 cells (f) and differentially expressed between the red (L75Pfs rod-like cells) and blue (WT cones) groups (g) versus random genes. h Confocal images demonstrating MEF2C (green) co-expression with ARR3 (purple) in cone photoreceptors of WT (left) and L75Pfs (right) organoids at d160. NR2E3+ nuclei (red) are present in WT but not in L75Pfs organoids. Scale bar = 10 μm.

