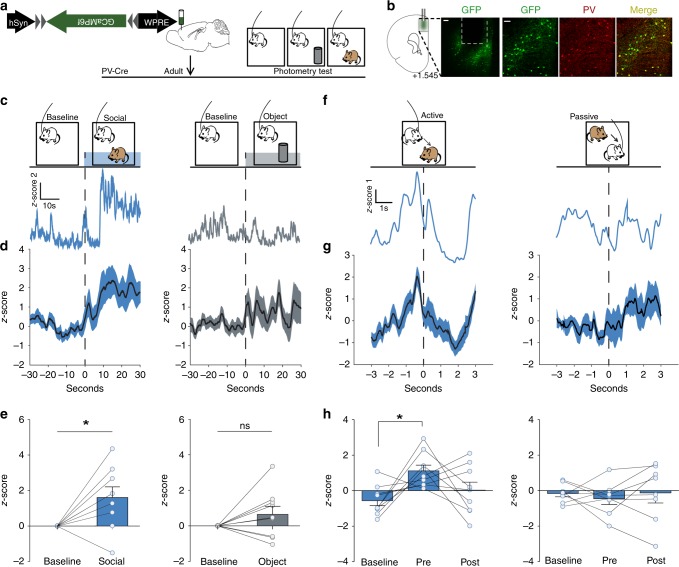
Fig. 1. Short activation of dmPFC PVIs precedes an active social approach.
a Timeline showing injection of GCaMP6f in adult dmPFC in PV-Cre mice and subsequent behavioral testing paradigm for fiber photometry imaging (order of object and social exploration was counterbalanced). b Example location of fiber ferrule and GCaMP6f expression in mouse PFC (left) and co-localization of GCaMP6f expression (green) and PV staining (red). (left, scale bar = 100 μm; right, scale bar = 50 μm). c, d GCaMP6f signals of dmPFC-PVIs show increased mean z-score 30 s after introduction of a novel mouse (left), but not a novel object (right). c Example GCaMP signal traces. d Mean + /− SEM smoothed signal. e Mean dmPFC-PVI GCaMP6f signal for each mouse comparing baseline and post stimulus introduction for social and object (Wilcoxon signed-rank test, n = 9 mice, social: *p = 0.03, object: p = 0.25). f Top: active behavior, defined as behavior initiated by the focal mouse (left) and passive behavior, defined as behavior initiated by the stimulus mouse (right) were scored during photometry imaging. Bottom: Representative responses from the first active and first passive bout shows an increase in dmPFC-PVI activity immediately prior to the active bout initiation. No change is seen in the passive bout. g Mean + /− SEM smoothed signal for the first active and passive bout. h Mean dmPFC-PVI GCaMP6f signal for each mouse comparing baseline (−3 to −2 s before active/passive initiation) pre (−1 to 0 s) and post (0–1 s). (One-way repeated measures ANOVA, active (left): F(2,8) = 4.67, *p = 0.02, Tukey post hoc tests, active baseline vs pre, *p < 0.05, n = 9 mice. Passive (right): F(2,7) = 0.27, p = 0.77, n = 8 mice). All error bars reflect + /− SEM. See related Supplementary Figs. 1 and 2. Source data is available as a Source Data file.

