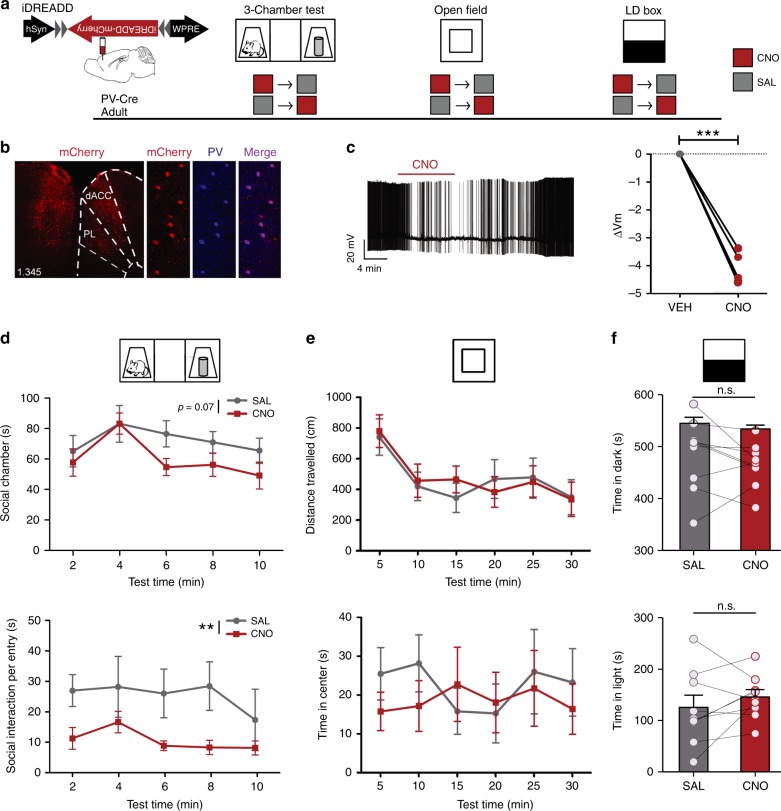
Fig. 3. Chemogenetic suppression of adult dmPFC-PVIs activity disrupts social behavior.
a Timeline showing injection of Cre-dependent inhibitory DREADD (iDREADD) virus to dmPFC of adult PV-Cre mice and subsequent repeated measures behavioral design. For CNO (red square) and SAL (gray square) injections, each mouse is tested under both CNO and SAL conditions, and the order is counterbalanced for each behavior test. b Representative injection of inhibitory DREADD injected in dmPFC of PV-Cre mouse (left, scale bar = 100 μm) and co-localization of DREADD virus expression (mCherry, red) with PV staining (blue) (right, scale bar = 50 μm). c Validation of iDREADD in dmPFC-PVI. Left: representative trace of whole-cell recording from a PVI in adult dmPFC slice upon CNO bath application. Right: change in membrane potential from vehicle after CNO application. Repeated measures t test, t = 16.68, df = 5, ***p < 0.001, n = 6 cells from three mice. d Three-chamber tests show trending decreases in time in social chamber (top), and significant decreases in time interacting per social chamber entry (bottom) when PVIs are suppressed with CNO, compared with saline. (n = 9 mice. Two-way repeated measures ANOVA, effect of the drug: F(1,8) = 4.39, p = 0.07 (top), F(1,8) = 14.28, p = 0.005 (bottom)). e No effect of the drug was seen on distance traveled (top) or time in the center vs. periphery (bottom) in an open-field test (two-way repeated measures ANOVA, distance traveled: effect of the drug, F(1,7) = 0.01, p = 0.92, time in the center: effect of the drug, F(1,7) = 0.21, p = 0.66, n = 8 mice), or in f the light–dark (LD) box test in either time in the dark (top) or time in the light (bottom), (paired t test, time in light: t = 1.089, df = 8, p = 0.31, time in the dark: t = 1.16, df = 8, p = 0.28, n = 9 mice). All error bars reflect + /− SEM. See related Supplementary Figs. 5 and 6. Source data are available as a Source Data file.

