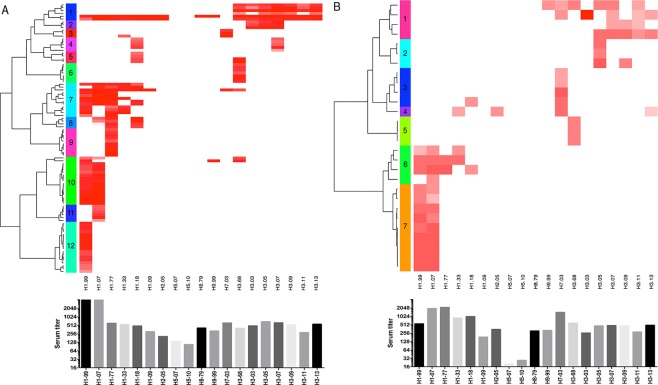
Figure 3.
Strain-specific reactivity of clones isolated from case 1 (A) and case 2 (B), presented as heatmap (upper figure). Each line in the heatmap represents the HA1 reactivity of clones produced by a single memory B-cell precursor cell. Heatmaps are generated by log2-transformation of the RFU and by applying hierarchical clustering, clusters are generated and indicated using different colors. The bar graph (below) represents the serum titer of both cases.

