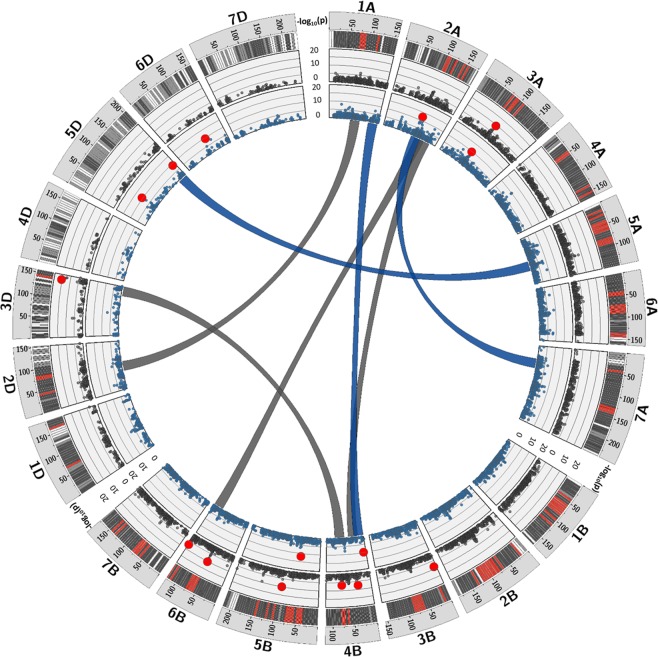
Figure 5.
Genetic architecture of Fusarium crown rot (FCR) resistant in 161 diverse wheat accessions. Outer circle represents distribution of SNPs on wheat chromosomes from white (low density) to red (high density). Two inner blue and black circles represent the Manhattan plots for corresponding QTLs (bold red) linked to FCR under growth room and greenhouse environment respectively. The epistatic interaction between the QTLs are indicated by blue (GR) and black (GH) connector links in the center of the plot.

