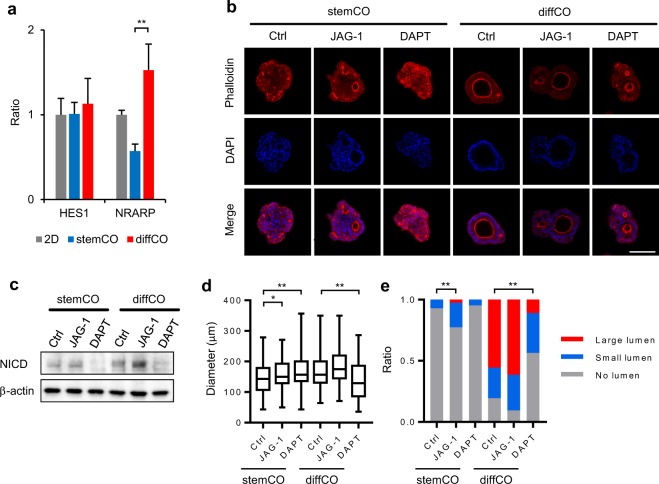
Figure 4.
Notch signaling is associated with lumen formation in PLR123 stemCO and diffCO. (a) Expression of Notch markers HES1 and NRARP in Day 10 stemCO and diffCO was analysed by quantitative RT-PCR. The relative expression ratio was calculated in relation to a 2D control. Data represent mean + s.d. (n = 3). **p < 0.01, Student t test. (b) Representative whole mount immunostaining images of phalloidin (red) and DAPI (blue) in stemCO and diffCO treated with DMSO control, 20 μM JAG-1, or 10 μM DAPT on Days 3–10. Scale bar = 100 μm. (c) Cropped images of western blot analysis of Notch intracellular domain expression in stemCO and diffCO treated with DMSO control, 20 μM JAG-1, or 10 μM DAPT on Days 3–10. β-actin was used as a control. Full-length blots are presented in Supplementary Fig. S3. NICD: Notch intracellular domain. (d) The longitudinal diameter of stemCO and diffCO found in each condition in (b) (between 84 and 125 stemCO or diffCO each) was calculated and represented as box-and-whisker plot. *p < 0.05; **P < 0.01, Dunnett’s test compared with DMSO control. (e) The longitudinal diameter of the largest lumen in each stemCO and diffCO in (b) were measured and the percentages in relation to the size of the corresponding stemCO or diffCO were calculated. Each was classified as having large lumens (≥25%), small lumens (<25%), or no lumens. Data represent the ratio of stemCO and diffCO with large, small, or no lumens in each condition. **p < 0.01, Chi-squared test compared with DMSO control. For the statistical analysis of stemCO, large and small lumens were combined to increase the expected frequency.

