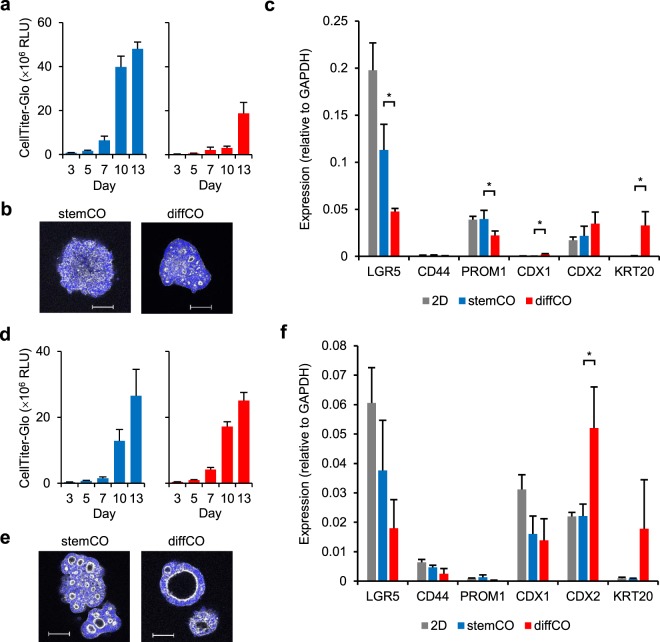
Figure 5.
3D cultures of colorectal cancer cell lines LoVo and LS174T. LoVo cells (a–c) or LS174T cells (d–f) were adapted to SCM and used for 3D cultures. (a,d) Growth of the 3D cultures was analysed with CellTiter-Glo. Data represent mean + s.d. (n = 6). (b,e) Representative whole mount immunostaining images of phalloidin (white) and DAPI (blue) in cultures on Day 13. Scale bars = 100 μm. (c,f) Expression of CSC (LGR5, CD44, PROM1) and differentiation (CDX1, CDX2, KRT20) markers by quantitative RT-PCR analysis. With LoVo cells, cultures on Day 10 and 13 were examined for stemCO and diffCO culture conditions, respectively. With LS174T cells, cultures on Day 13 were examined for both culture conditions. Data represent mean + s.d. (n = 3). *p < 0.05, Student t test.

