Figure 3.
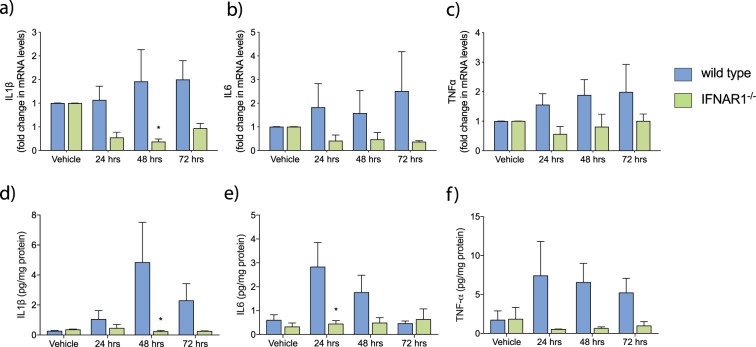
The inflammatory response to Aβ1–42 is attenuated in IFNAR1−/− primary microglia. Transcript levels of (a) IL1β, (b) IL6 and (c) TNFα were analysed by QPCR analysis following 10 μM monomeric Aβ1–42 treatment (24–72 hours). Collected media was also analysed via ELISA for the corresponding cytokines (d) to (f). Data is displayed as mean ± SEM (*p < 0.05, 2-way ANOVA, Sidak’s multiple comparisons test, wild type vs. IFNAR1−/–, n = 5).

