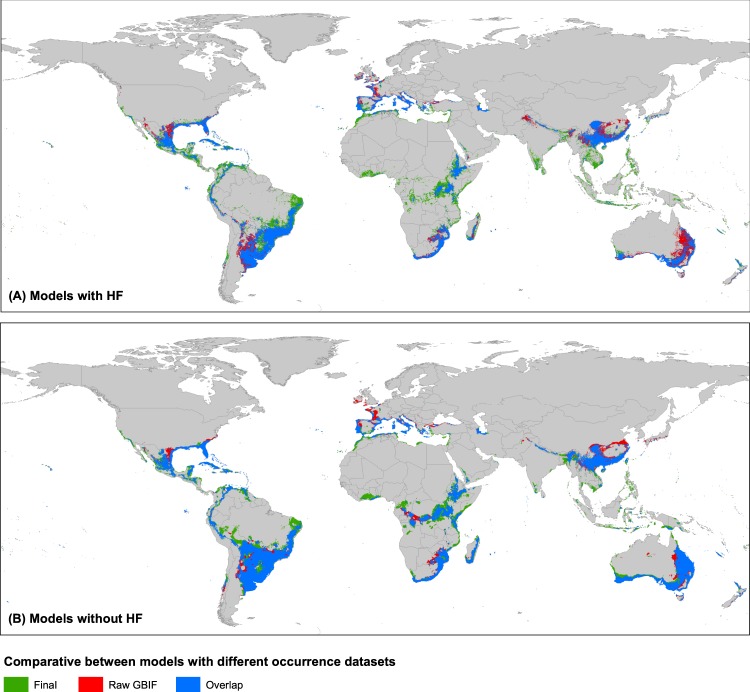
Figure 7.
Comparison of potential distribution areas considering two input occurrence datasets: Final dataset (multi-source searching and verified; 644 records) and Raw GBIF dataset (directly downloaded from the platform; 128 records). Ecological niche models were performed at present for two input variable datasets (A) including Human Footprint (HF) or (B) without HF. The color ranges indicated: in blue, the overlapped areas between final and raw GBIF datasets; in green, suitable areas in models of final dataset; and in red, suitable areas in models of raw GBIF dataset.

