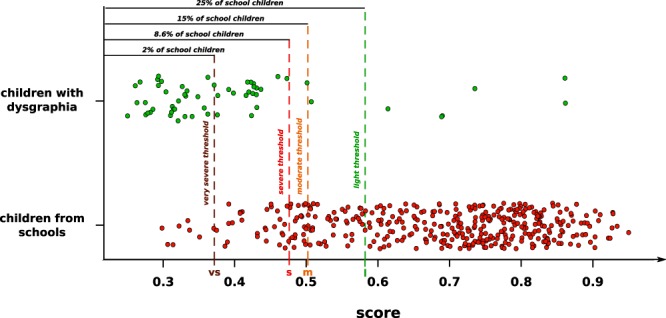
Figure 4.

Scores computed for all the children in our database. The red points represent children recruited from schools, while the green points represent children with dysgraphia. Four threshold values (very severe, severe, moderate, light) were used to divide handwriting difficulties into five categories with 2% of school children below the very severe threshold (this allowed us to compute the vs value), 8.6% of school children below the severe threshold (this allowed us to compute the s value, which is the current dysgraphia threshold), 15% of children below the moderate threshold (this allowed us to compute the m value) and 25% of children below the light threshold (this allowed us to compute the l value). It is important to note that these thresholds have been set as examples, meaning that any other values can be used. The score is proportional to the handwriting quality.
