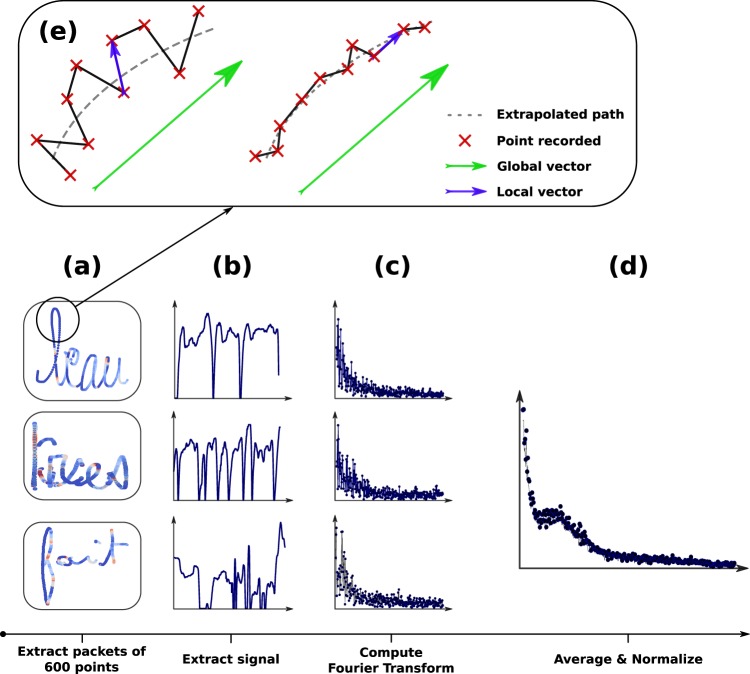
Figure 7.
The whole process used to extract the frequency spectrum of our signal. (a) We first divided the BHK text into bins of 600 points. (b) For each packet, the signal was extracted. (c) We computed the Fourier transform of the signal. (d) We took the average of all signals and performed a normalization. (e) In these sample signals extracted from the data, the red dots are the point coordinates recorded by the device during handwriting, the vectors in blue are “local” vectors linking two consecutive points and the vector in green is the "global” vector (average of the nine blue vectors) representing the global direction of the handwriting. The cross product of these two vectors gives us an indication of the smoothness/shakiness of the handwriting. The right side of the figure comes from a writer with smoother/less shaky handwriting than the writer producing the one on the left, and the cross product operation will detect this difference. This image has been adapted from21.

