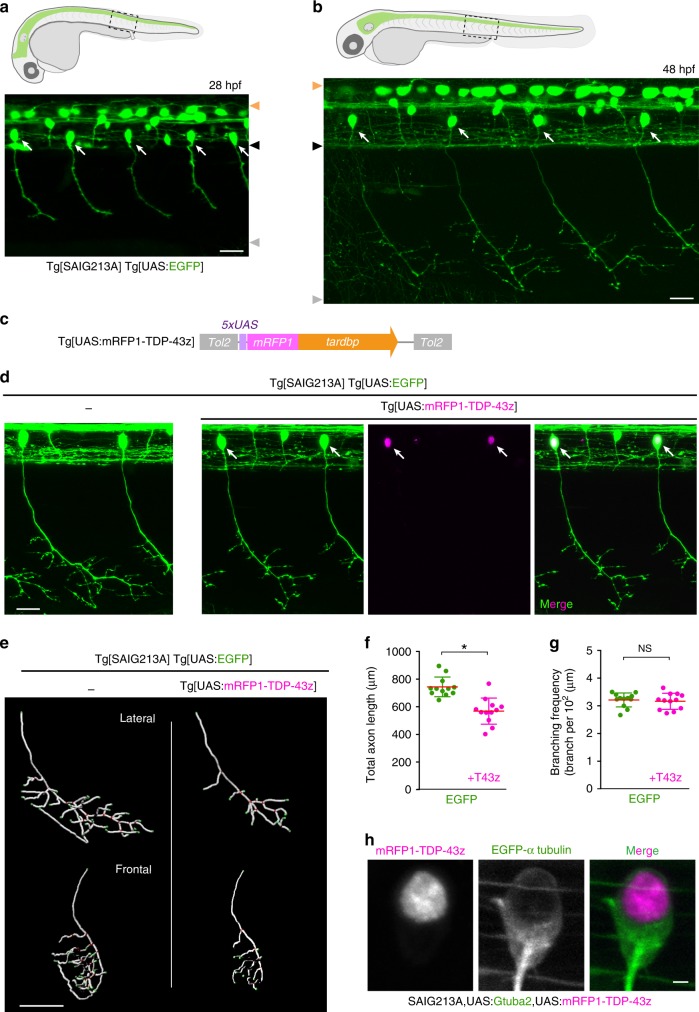
Fig. 1. TDP-43 overexpression halts axon outgrowth independently of cytoplasmic aggregation.
a, b CaPs (arrows) in Tg[SAIG213A] Tg[UAS:EGFP] fish. Orange, black and gray arrowheads indicate dorsal and ventral limits of the spinal cord, and ventral myotomal borders, respectively. c The structure of Tg[UAS:mRFP1-TDP-43z. d CaPs in Tg[SAIG213A] Tg[UAS:EGFP] (left) and Tg[SAIG213A] Tg[UAS:EGFP] Tg[UAS:mRFP1-TDP-43z] (right) larvae at 48 hpf. Arrows indicate CaPs expressing mRFP1-TDP-43z. e The lateral and frontal views of skeletonized CaP axons of Tg[SAIG213A] Tg[UAS:EGFP] (left) and Tg[SAIG213A] Tg[UAS:EGFP] Tg[UAS:mRFP1-TDP-43z] (right). The axon branch points and terminals are indicated by red and green, respectively. (See also Supplementary Movie 1). f, g Total length and branching frequency of CaP axons at the spinal segment 14–17 of Tg[SAIG213A] Tg[UAS:EGFP] (green, 12 cells, 5 animals) and Tg[SAIG213A] Tg[UAS:EGFP] Tg[UAS:mRFP1-TDP-43z] (magenta, 12 cells, 6 animals). *p < 0.0001 (unpaired t-test, two-tailed). NS, not statistically significant (p = 0.66). h Localization of mRFP1-TDP-43z in a CaP of Tg[SAIG213A] Tg[UAS:Gtuba2] Tg[UAS:mRFP1-TDP-43z] at 48 hpf. EGFP-tagged α-tubulin expressed from Tg[UAS:Gtuba2]64 serves as a marker for the cytoplasm. The bars indicate 20 µm (a, b, d), 40 µm (e), and 2 µm (h). Error bars show standard deviation (SD).

