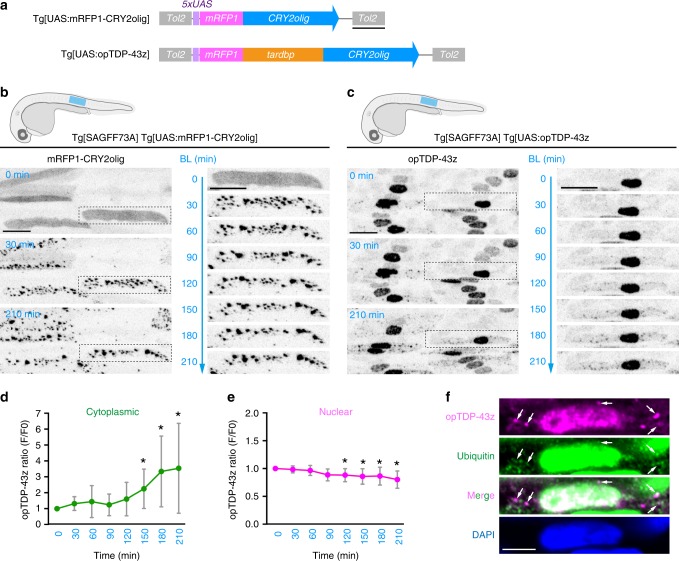
Fig. 2. A photo-switchable TDP-43: opTDP-43.
a The structures of Tg[UAS:mRFP1-CRY2olig] and Tg[UAS:opTDP-43z]. b, c Skeletal muscle of Tg[SAGFF73A] Tg[UAS:mRFP1-CRY2olig] and Tg[SAGFF73A] Tg[UAS:opTDP-43] fish from 28 hpf (0 min) to 31.5 hpf (210 hpf). The blue light was illuminated from 0 to 210 min. Montages of single skeletal muscle cells expressing mRFP1-CRY2olig and opTDP-43z (dashed boxes) are shown on the right. d, e The averaged change of opTDP-43z intensity in the cytoplasm (d) and nucleus (e) of skeletal muscle cells in Tg[SAGFF73A] Tg[UAS:opTDP-43z] fish during the illumination (N = 8 cells from the same animal). Error bars show SD, and the center of the error bars is the mean. The asterisks indicate the statistically significant change in opTDP-43z fluorescence intensity at each time point in comparison to the opTDP-43z level at t = 0, and adjustments were not made for multiple comparisons. In d p = 0.0125, 0.010, 0.0234 at 150, 180, 210 min, respectively (unpaired t-test, two-tailed). In e p = 0.0092, 0.0128, 0.0114, 0.0311 at 120, 150, 180, 210 min, respectively. f Immunofluorescence of the skeletal muscle of fish illuminated for 3.5 h, using anti-RFP (for opTDP-43z) and anti-ubiquitin antibodies. Arrows indicate the representative of opTDP-43z foci that are partially ubiquitinated. The bars indicate 500 bp (a), 20 µm (b, c), and 5 µm (f).

