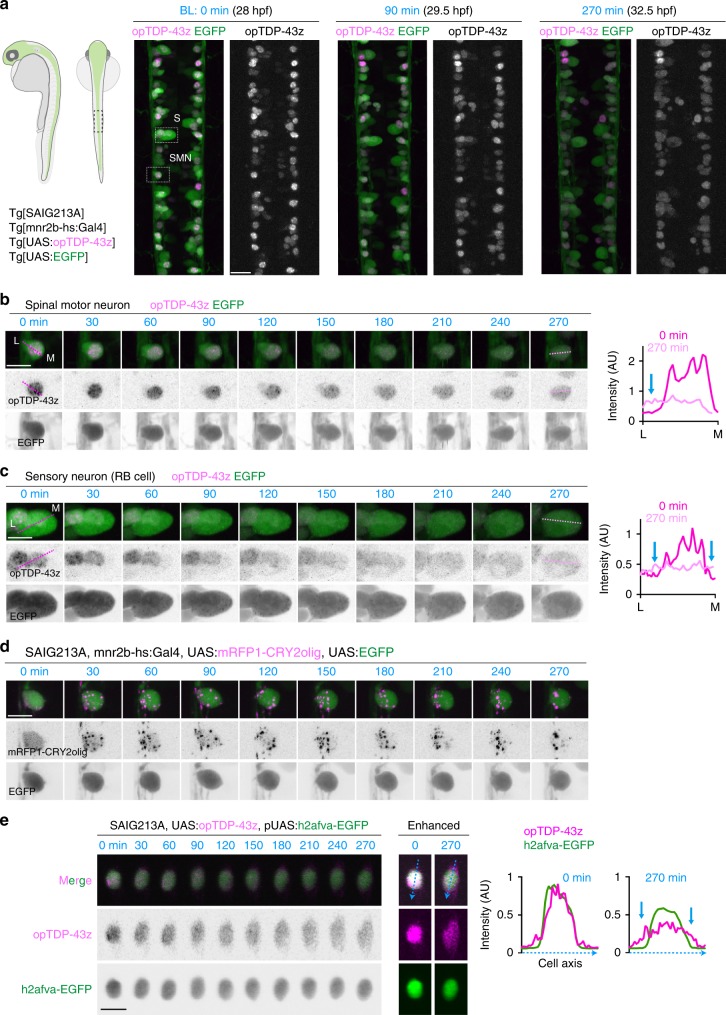
Fig. 3. Light illumination-dependent cytoplasmic mislocalization of opTDP-43 in neuronal cells.
a The dorsal view of the spinal cord at the segment 14–17 levels of a Tg[SAIG213A] Tg[mnr2b-hs:Gal4] Tg[UAS:opTDP-43z] Tg[UAS:EGFP] quadruple transgenic fish. A spinal motor neurons (SMN) and a Rohon-Beard sensory neuron (RB cell, S) were highlighted with dashed boxes and analyzed in detail in (b, c). b, c Montages of the spinal motor neurons and the RB cell during the light illumination. The graphs show the fluorescent intensities of opTDP-43z along the dotted line drawn from the lateral (L) to medial edges (M) of the EGFP signal. The blue arrows indicate the cytoplasmic increase of opTDP-43z. The unit for y-axes are the same between 0 and 270 min. d Montage of the spinal motor neuron expressing mRFP1-CRY2olig in the same illumination condition as in (a). e Cytoplasmic mislocalization of opTDP-43z in Tg[SAIG213A] Tg[UAS:opTDP-43z] fish injected with a plasmid harboring UAS regulated EGFP-tagged histone H2A variant H2afva. The graphs show the fluorescent intensities of opTDP-43z and EGFP-H2afva along blue dotted line drawn across the cell axes. The blue arrows indicate the cytoplasmic increase of opTDP-43z. The bars indicate 20 µm (a), 10 µm (b–e).

