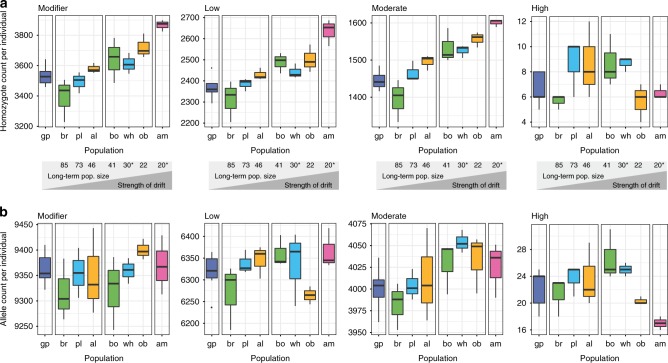
Fig. 4. Impact of the recolonization on the individual mutation load.
a Homozygote counts and (b) allele counts per individual for each Alpine ibex population. The schematic between A and B indicates the harmonic mean of the census size of each population, which is inversely correlated with the strength of drift. * Estimated numbers. Colors associate founder and descendant populations (see also Fig. 3a). Box plot elements are defined as in Fig. 1. Source data are provided as a Source Data file.

