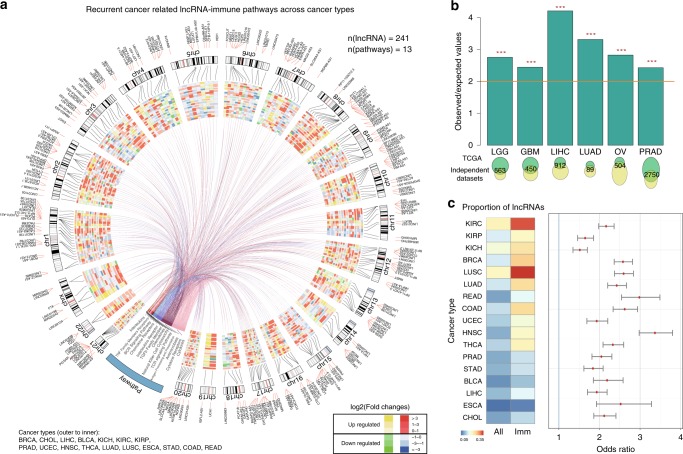
Fig. 2. Validation of immune-related lncRNAs.
a. Circos plot showing the 500 top-ranked lncRNA–pathway pairs across cancer types. The inner heat map shows the differential expression of lncRNAs across cancer types. Red and yellow colors represent upregulation; blue and green colors represent downregulation. b The overlap of immune–lncRNA pathways in independent datasets of the same cancer type. The top bar plots show the observed/expected values of the hypergeometric test. The bottom Venn plots show the number of overlapping lncRNA–pathway pairs. ***all P < 2.2E-16, two-sided hypergeometric tests. c The left heat map shows the proportion of differentially expressed lncRNAs of all lncRNAs and of immune-related lncRNAs. The right panel shows the odds ratios in each cancer type. All P < 0.01, two-sided Fisher’s exact tests. The error bars were 95% confidence levels of odds ratios. Source data are provided as a Source Data file.

