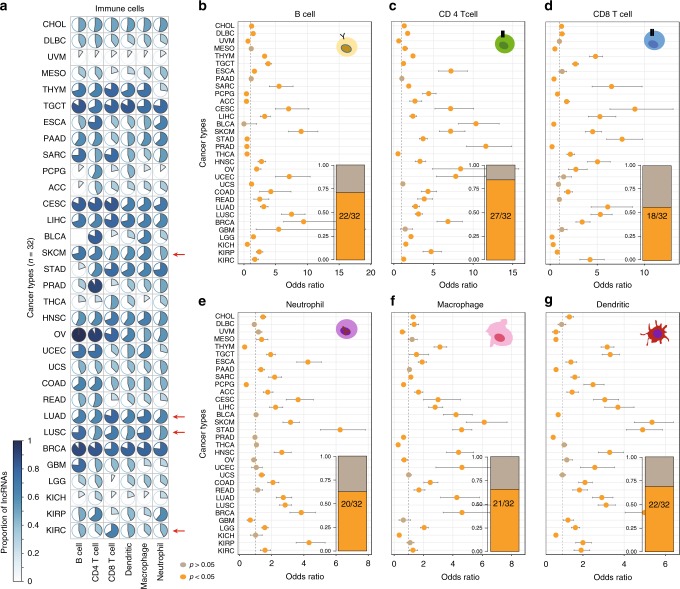
Fig. 3. The immune lncRNAs are correlated with immune cell infiltration in cancer.
a The proportion of immune lncRNAs that were correlated with immune cell infiltration. b–g The immune-related lncRNAs were likely to be enriched in lncRNAs that were correlated with immune cell infiltration. The dots represent the odds ratio (OR) of Fisher’s exact test and the error bars show the 95% confidence intervals of the OR. The numbers inside bar plots show the proportion of cancers, where orange indicates cancers with P-values < 0.05 and OR > 1 in two-sided Fisher’s exact test. b B cells; c CD4 T cells; d CD8 T cells; e neutrophils; f macrophages; and g dendritic cells. Source data are provided as a Source Data file.

