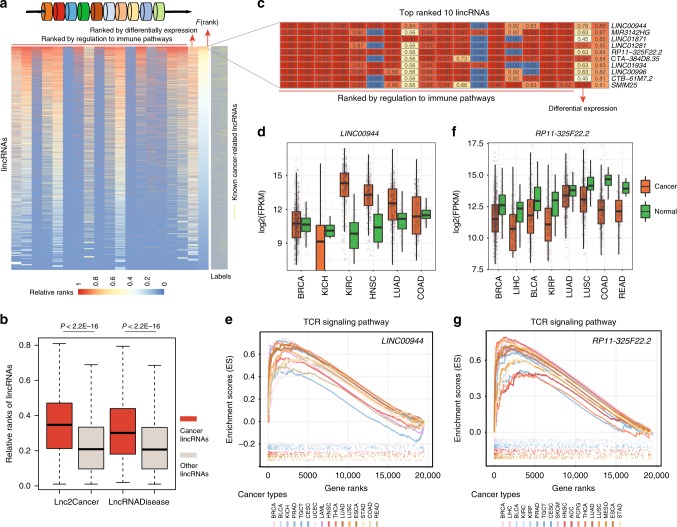
Fig. 4. Prioritization of cancer-related lncRNAs based on immune regulation.
a The distribution of average rank for lincRNAs. Each column is the normalized rank score for lincRNAs. The first 17 columns are based on immune pathway regulation and the 18th column is based on differential expression. The last column is the final score for each lincRNA. The known cancer-related lncRNAs are colored in yellow. b The relative rank score distribution of cancer-related lincRNAs and other lincRNAs. ***P < 2.2E − 16, one-sided Wilcoxon’s rank-sum test. c Heat map showing the normalized rank scores for the ten top-ranked lincRNAs. d The distribution of expression for LINC00944 in different cancer types. e The enrichment score (ES) distribution for the LINC00944–TCR (T cell receptor) signaling pathway. Each vertical bar represents a gene involved in the pathway. Each line is for one cancer type. f The distribution of expression for RP11-325F22.2 in different cancer types. g The enrichment score (ES) distribution for RP11-325F22.2–TCR signaling pathway. Each vertical bar represents a gene involved in the pathway. Each line is for one cancer type. The center of the boxplots are median values, the bounds of the boxes are 25% and 75% quantiles. The minima are 25% quantile − 1.5*interquartile range (IQR) and the maxima are 75% quantile + 1.5*IQR. Source data are provided as a Source Data file.

