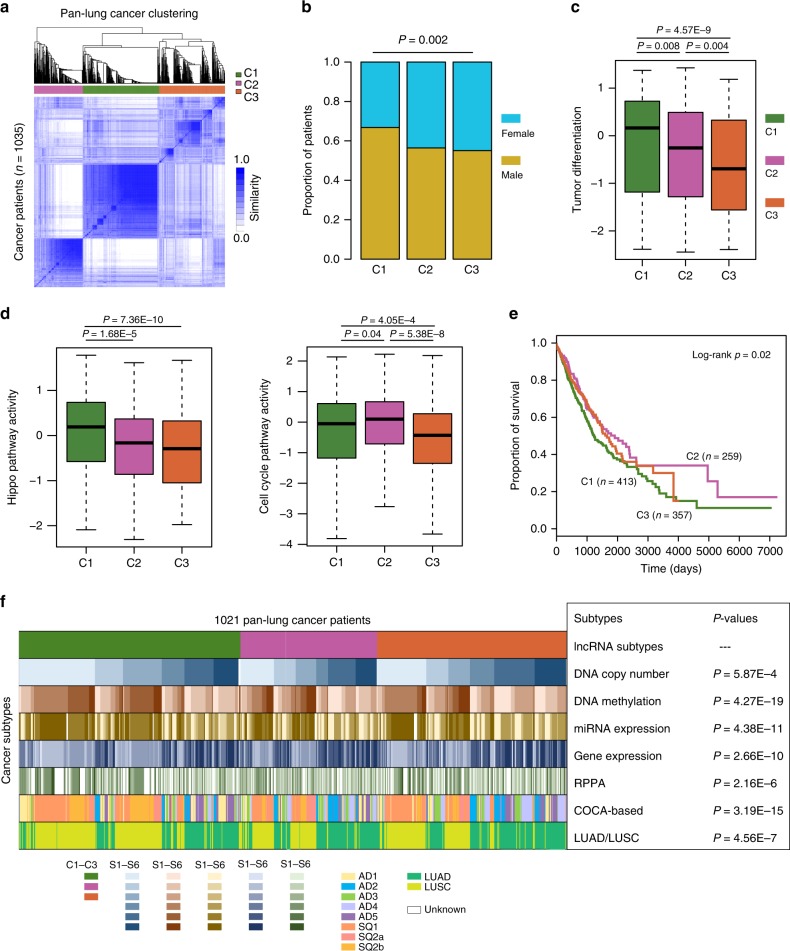
Fig. 5. Characterization of lung cancer subtypes.
a Heat map of the matrix of co-occurrence proportions for cancer patients. b The proportion of male and female patients of different subtypes. n1 = 410, n2 = 257, and n3 = 356 biologically independent samples examined. P = 0.002, two-sided Fisher’s exact test. c The distribution of tumor differentiation scores for patients of different subtypes. n1 = 411, n2 = 253, and n3 = 357 biologically independent samples examined. P-values for two-sided Wilcoxon’s rank-sum tests. d The distribution of hippo and cell cycle pathway activity for patients of different subtypes. n1 = 411, n2 = 253, and n3 = 357 biologically independent samples examined. P-values for two-sided Wilcoxon’s rank-sum tests. e The survival analysis using classifications generated from consensus clustering. C1 patients display a significantly poorer prognosis than C2 and C3 patients. f. Comparative analysis of different lung cancer subtypes. The center of the boxplots are median values, the bounds of the boxes are 25% and 75% quantiles. The minima are 25% quantile – 1.5*interquartile range (IQR) and the maxima are 75% quantile + 1.5*IQR. Source data are provided as a Source Data file.

