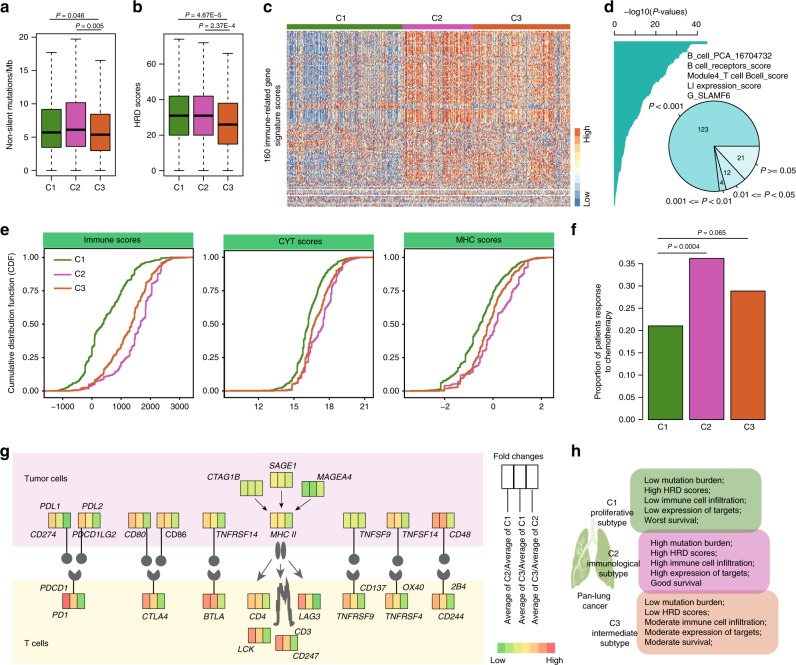
Fig. 6. The immunological characterization of different lung cancer subtypes.
a The mutation burden for patients in different subtypes. n1 = 392, n2 = 253, and n3 = 343 biologically independent samples examined. P-values for one-sided Wilcoxon’s rank-sum tests. b The HRD score distribution for patients in different subtypes. n1 = 405, n2 = 253, and n3 = 352 biologically independent samples examined. P-values for one-sided Wilcoxon’s rank-sum tests. c Heat map showing 160 immune-related gene signature scores for patients across different subtypes. d The distribution of P-values obtained by ANOVA analysis. The pie plot shows the proportion of signatures with different P-values. e The cumulative distribution of immune, CYT, and MHC scores for patients of different cancer subtypes. f The proportion of patients that respond to chemotherapy in different subtypes. Two-sided Fisher’s exact test. g Diagram of the immune checkpoint pathway, comparing tumors in different subtypes. h Summary of features for patients of different subtypes. The center of the boxplots are median values, the bounds of the boxes are 25% and 75% quantiles. The minima are 25% quantile − 1.5*interquartile range (IQR) and the maxima are 75% quantile + 1.5*IQR. Source data are provided as a Source Data file.

