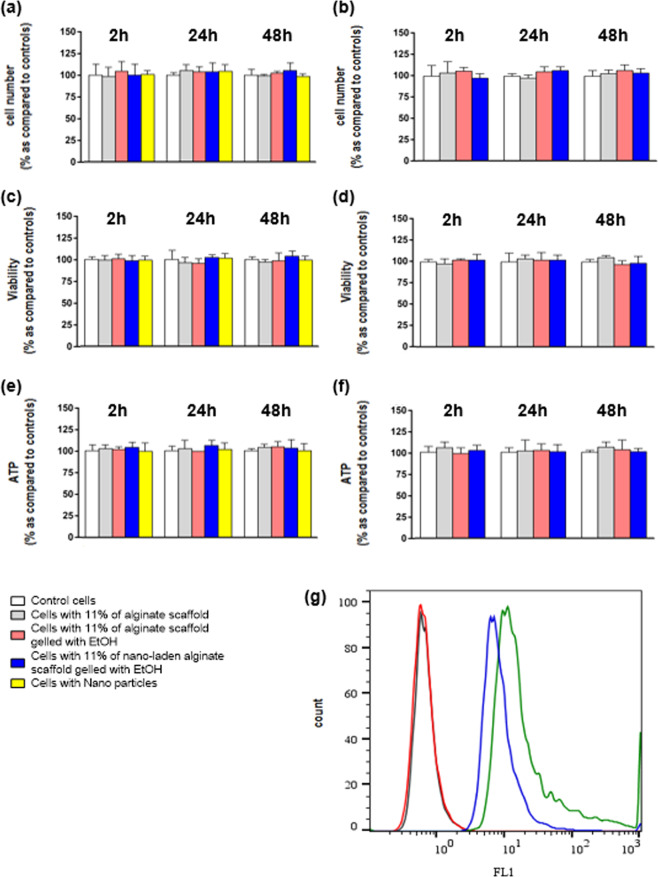
Figure 5.
In-vitro viability and metabolism evaluation in HUVEC line. (a) cell number evaluation at 2 h, 24 h and 48 h after scaffold direct dissolution in: (i) control cell (first column); (ii) cells after 11% of alginate administration (second column); (iii) cell after 11% of alginate administration and ethanol crosslinking (third column); (iv) cell after 11% of alginate administration, ethanol crosslinking and NPs administration (forth column); (v) cell after NPs administration (fifth column). (b) same as (a) for scaffold indirect dissolution. (c) cell viability evaluation at 2 h, 24 h and 48 h after scaffold direct dissolution in: i) control cell (first column); (ii) cells after 11% of alginate administration (second column); iii) cell after 11% of alginate administration and ethanol crosslinking (third column); (iv) cell after 11% of alginate administration, ethanol crosslinking and NPs administration (forth column); (v) cell after NPs administration (fifth column). (d) same as (c) for scaffold indirect dissolution. (e) ATP evaluation at 2 h, 24 h and 48 h after scaffold direct dissolution in: (i) control cell (first column); (ii) cells after 11% of alginate administration (second column); iii) cell after 11% of alginate administration and ethanol crosslinking (third column); (iv) cell after 11% of alginate administration, ethanol crosslinking and NPs administration (forth column); (v) cell after NPs administration (fifth column). (f) same as (e) for scaffold indirect dissolution. White columns: control cells; grey columns: cells with 11% of alginate scaffold; pink columns: cells with 11% of alginate scaffold gelled with EtOH; blue columns: cells with 11% of alginate scaffold gelled with EtOH containing NPs: yellow columns: cells with NPs. (g) Cytofluorimetric analysis of HUVEC control cell after 24 h (black trace), HUVECs and alginate after 24 h (red trace), HUVECs and alginate plus NPs after 2 h (green trace) and after 24 h (blue trace). Kruskal-Wallis (post hoc analyses: Dunn’s multiple comparison) was performed and statistical significance was set at p < 0.05. Data are represented as mean ± SEM.

