Figure 6.
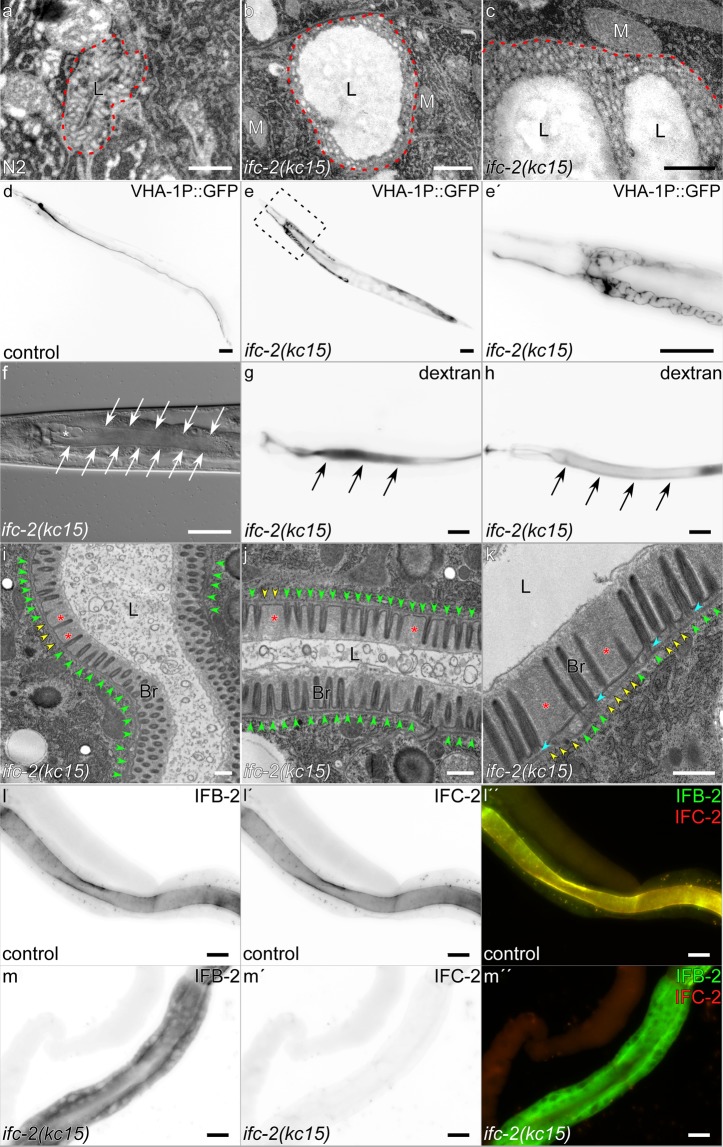
Knockout of IFC-2 leads to severe excretory canal defects and luminal widening of the intestine with cytoplasmic mislocalization of IFB-2. (a–c) Electron micrographs of wild-type and ifc-2(kc15) mutant excretory canals. Note the massively dilated lumen (L) in the mutant compared to control animals (excretory canal surrounded by canaliculi demarcated by red dotted line). M, mitochondrion. (d–e′) Microscopy of worms producing GFP controlled by the excretory canal-specific promotor VHA-1P either in a wild-type background (d) or in an ifc-2(kc15) mutant (e; higher magnification in e′). Note the shortened, thickened and tortuous lumen of the mutant excretory canal. (f) Differential interference contrast image of an ifc-2(kc15) mutant depicting shortened and dilated excretory canal with prominent cysts (asterisk) and the substantially dilated intestine (arrows). (g,h) Fluorescence microscopy of ingested fluorescent dextran in the intestine of adult ifc-2(kc15) mutants depicting luminal widening (arrows; control in Fig. 5k). (i–k) The electron micrographs depict partial thinning of the electron-dense periluminal endotube (yellow versus green arrowheads). Microvillar actin filament bundles anchoring at the endotube are still discernible (blue arrowheads in k) but microvillus spacing is increased often in regions with thinner endotube (red asterisks in i–k). L, lumen; Br, brush border. (l–m′′) The immunofluorescence images show the distribution of IFB-2 (l,m) and IFC-2 (l′,m′; merged images in l′′,m′′) in isolated intestines of either control (l–l′′) or ifc-2(kc15) mutant animals (m-m′′). In control intestines, IFB-2 and IFC-2 display a smooth periluminal staining, while no IFC-2 signal can be detected in ifc-2(kc15). This is accompanied by substantial loss of apical IFB-2 localization. Scale bars: 500 nm in (a-c,i–k); 50 µm in d,e; 40 µm in f; 20 µm in (e′,g,h,l–m′′).

