Figure 2.

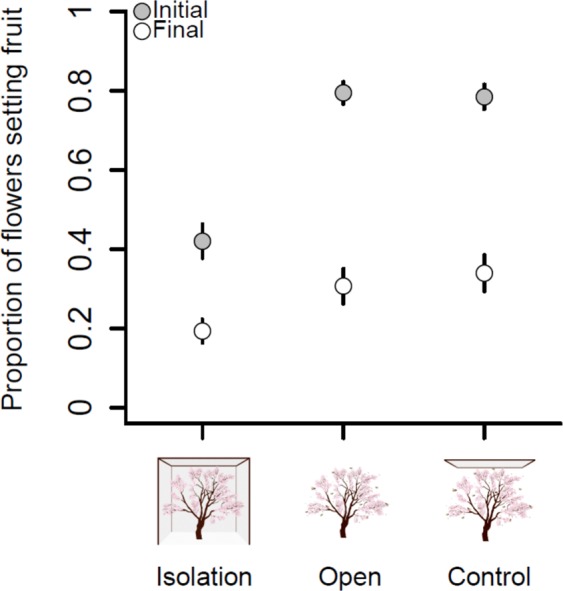
Initial and final fruit set per pollination treatment. Effects of the pollination treatment (isolation, open and control) on initial (gray) and final (white) fruit set. Points represent mean values and bars represent two standard errors.

Initial and final fruit set per pollination treatment. Effects of the pollination treatment (isolation, open and control) on initial (gray) and final (white) fruit set. Points represent mean values and bars represent two standard errors.