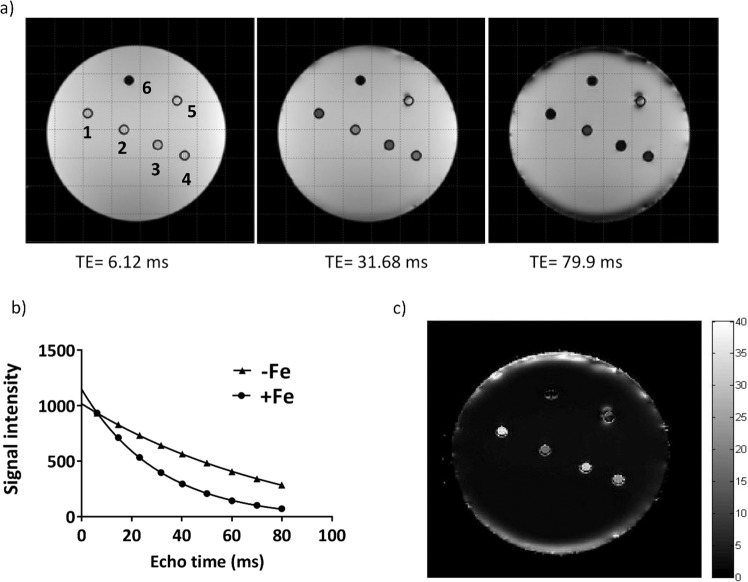
Figure 4.
Transverse relaxation rate measurement and mapping in the spherical phantom. (a) Signal intensity decreases over time in a T2*-weighted image of a representative phantom set up. Sample wells are labelled counter clockwise from 1 to 5, indicating +Fe, −Fe, 24h-Fe, 24h-Fe and +Fe + H, respectively. Number 6 shows the plastic peg for reference. (b) Signal decay curves are shown for +Fe and −Fe conditions. Each point shows the mean signal intensity measured within the defined ROI. The best fit for an exponential decay is shown by each curve. Iron supplementation resulted in an increase in R2* (1/T2*). (c) The R2* map illustrates a representative phantom. The map was obtained using voxel by voxel curve fitting with an exponential decay function. Higher R2* is observed for the +Fe condition (1) compared to −Fe (2).

