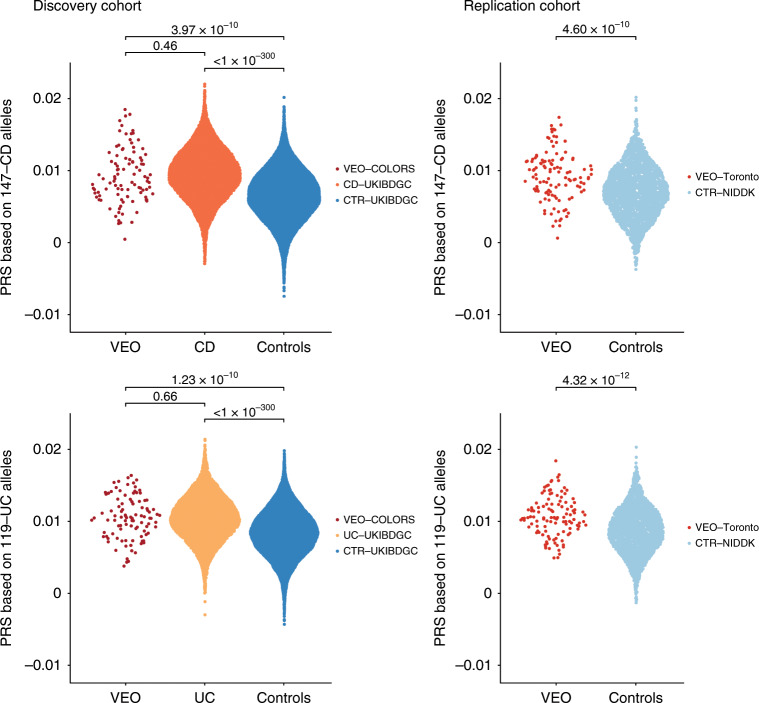
Fig. 3. Distribution of CD and UC risk scores in VEO-IBD, CD, UC cases and healthy controls.
The CD score was calculated using 147 CD risk alleles and the UC score using 119 UC risk alleles. Both scores were generated for a discovery cohort comprising 99 VEO-IBD cases (VEO-COLORS), 7578 CD cases, 6318 UC cases, 18,780 UK population controls (from the UKIBDGC), all of European ancestry. The replication cohort comprised 117 VEO-IBD cases (VEO Toronto) and 2603 population controls (from the NIDDK Genetics Consortium). The CD and UC risk scores did not significantly differ between the two VEO-IBD cohorts (CD P = 0.98; UC P = 0.64). The Student’s t-test was used in group comparisons.

